Network Infrastructure Weathermap

The main goal of collecting metrics is to store them for long term usage and to create graphs to debug problems or identify trends. However, storing metrics about your system isn’t enough to identity the problem’s & anomalies root cause. It’s necessary to have a high-level overview of your network backbone. Weathermap is perfect for a Network Operations Center (NOC). In this post, I will show you how to build one using Open Source tools only.


Icinga 2 will collect metrics about your backbone, write checks results metrics and performance data to InfluxDB (supported since Icinga 2.5). Visualize these metrics in Grafana in map form.

To get started, add your desired host configuration inside the hosts.conf file:

1
2
3
4
5
6
7
8
9
10
11
12
13
14
15
object Host "server1" {
import "generic-host"
address = "13.228.28.25"
vars.os = "cisco"
vars.city = "Paris"
vars.country = "FR"
}

object Host "server2" {
import "generic-host"
address = "13.228.28.26"
vars.os = "junos"
vars.city = "London"
vars.country = "GB"
}

Note: the city & country attributes will be used to create the weathermap.

To enable the InfluxDBWriter on your Icinga 2 installation, type the following command:

1
icinga2 feature enable influxdb

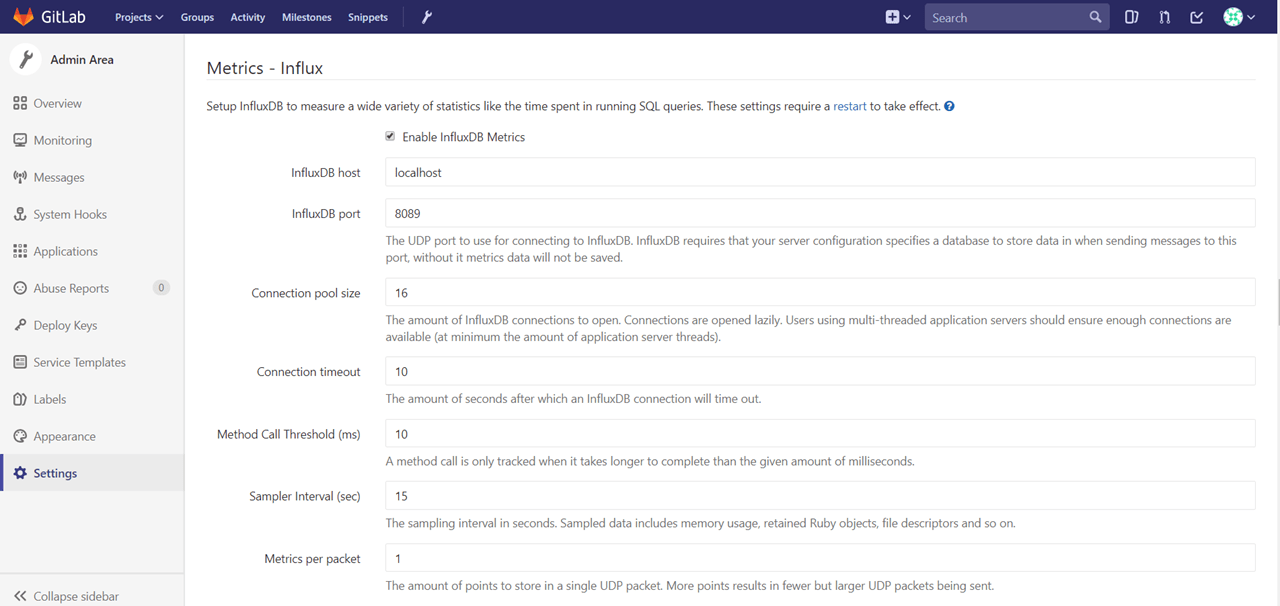
Configure your InfluxDB host and database in /etc/icinga2/features-enabled/influxdb.conf (Learn more about the InfluxDB configuration)

1
2
3
4
5
6
7
8
9
10
11
12
13
14
15
16
17
18
19
20
21
22
23
24
25
26
27
28
library "perfdata"

object InfluxdbWriter "influxdb" {
host = "localhost"
port = 8086
database = "icinga2_metrics"

flush_threshold = 1024
flush_interval = 10s
enable_send_metadata = true
enable_send_thresholds = true

host_template = {
measurement = "$host.check_command$"
tags = {
hostname = "$host.name$"
city = "$city$"
country = "$country$"
}
}
service_template = {
measurement = "$service.check_command$"
tags = {
hostname = "$host.name$"
service = "$service.name$"
}
}
}

Icinga 2 will forward all your metrics to a icinga2_metrics database. The included host and service templates define a storage, the measurement represents a table by which metrics are grouped with tags certain measurements of certain hosts or services are defined (notice the city & country tags usage).

Don’t forget to restart Icinga 2 after saving your changes:

1
service icinga2 restart

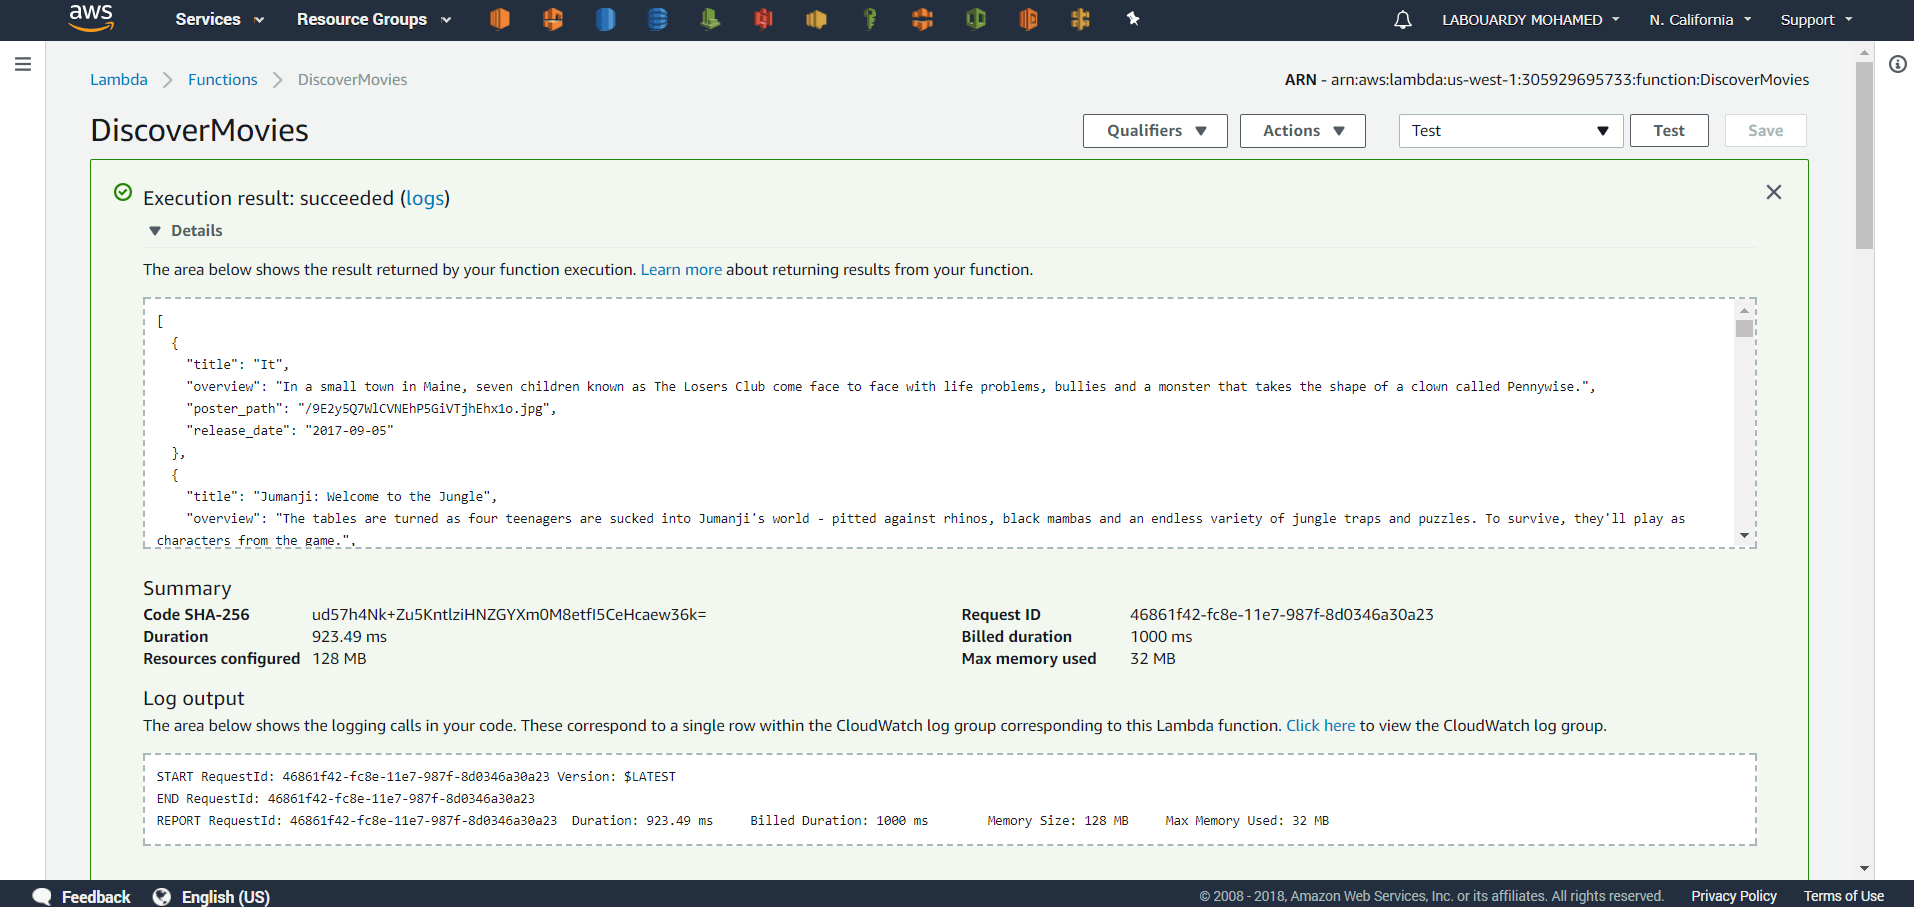
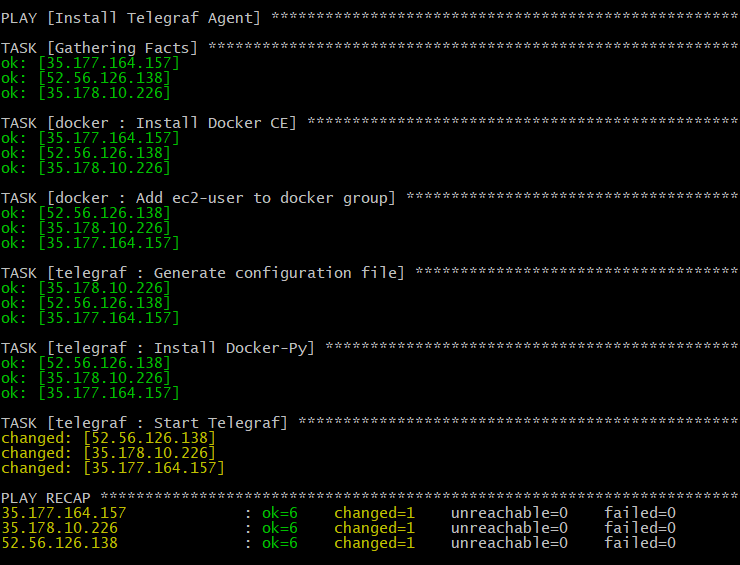
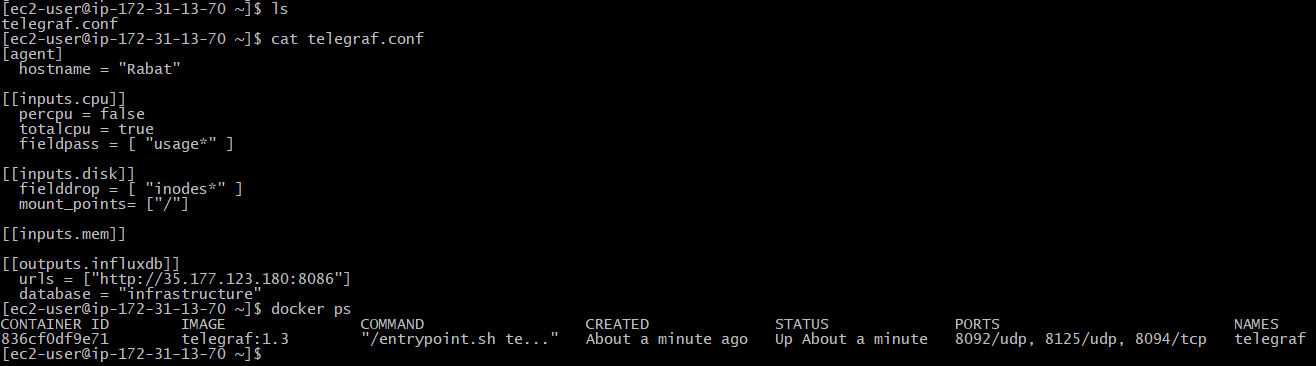
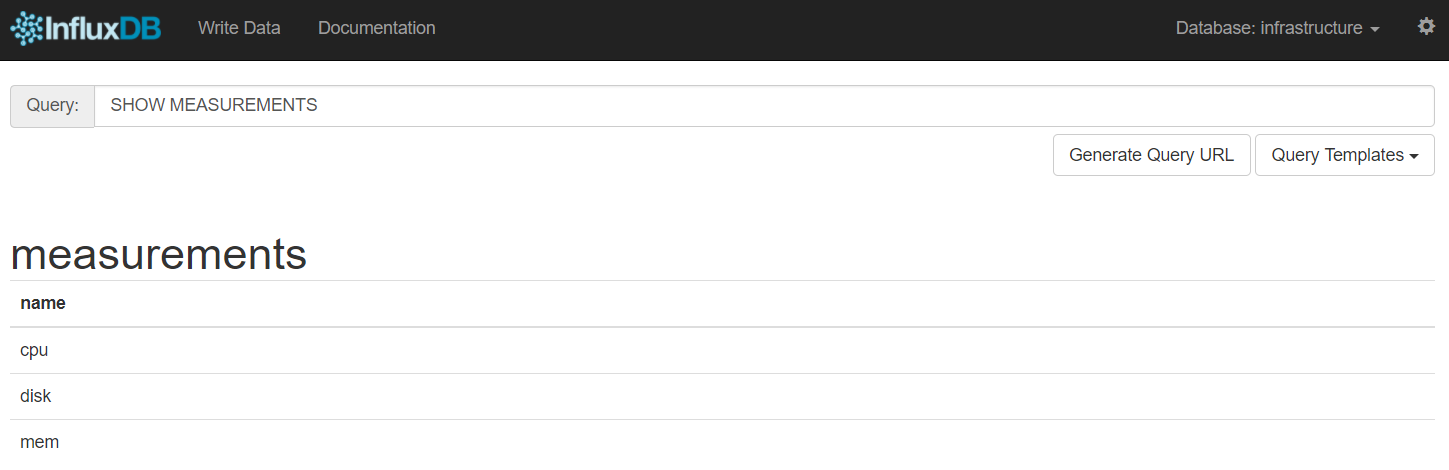
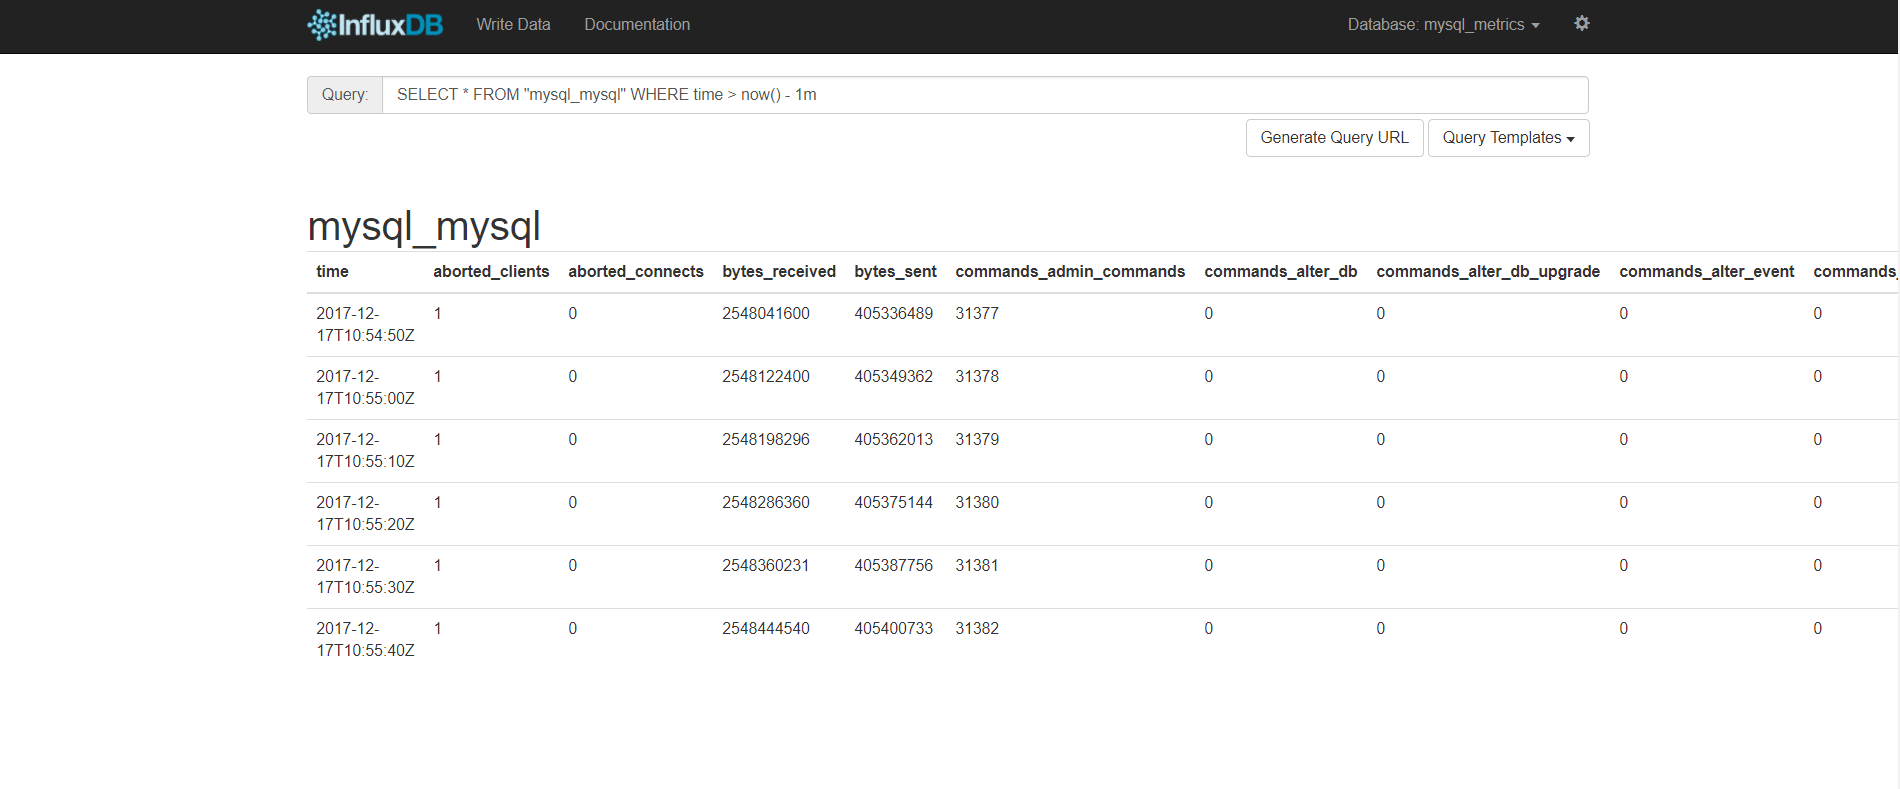
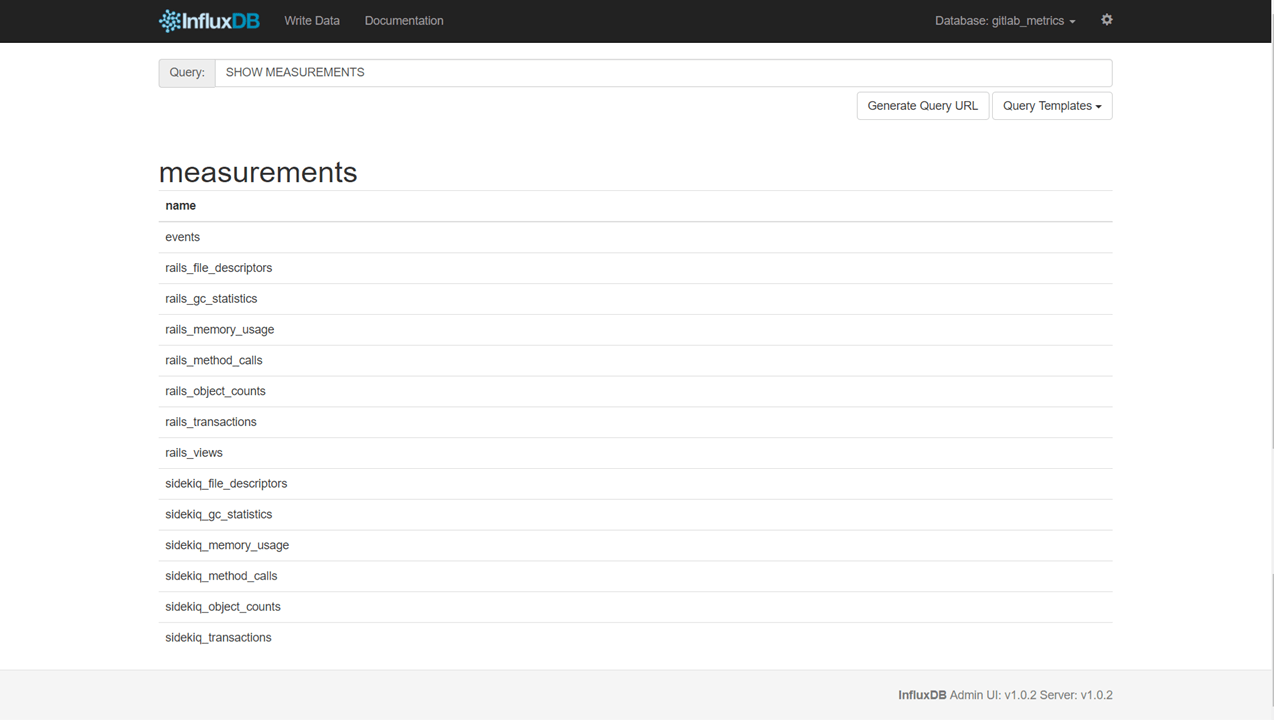
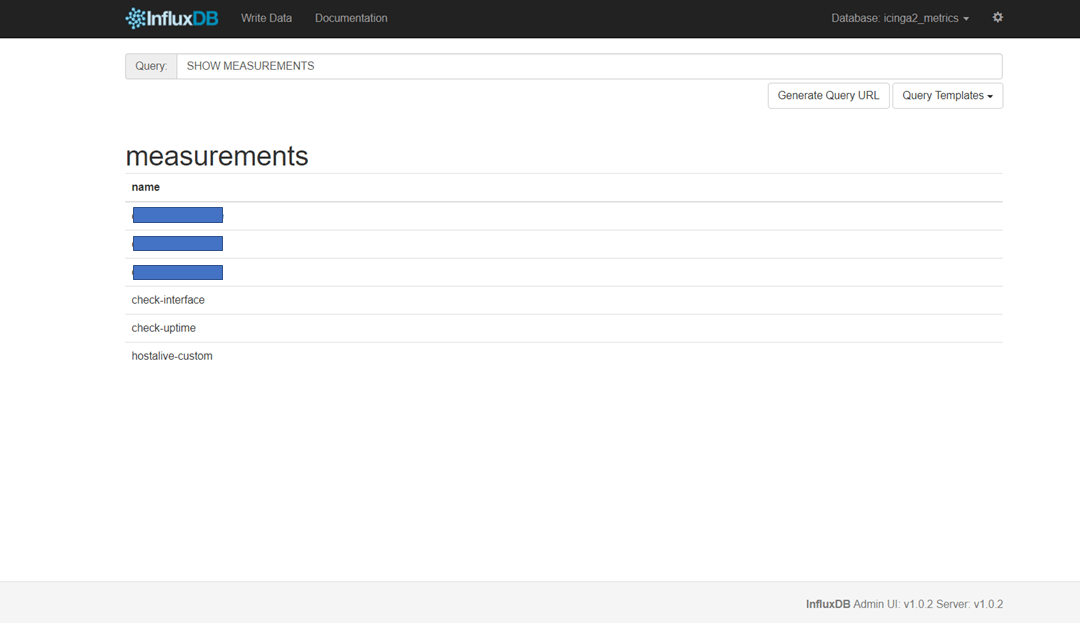
Once Icinga 2 is up and running it’ll start collecting data and writing them to InfluxDB:


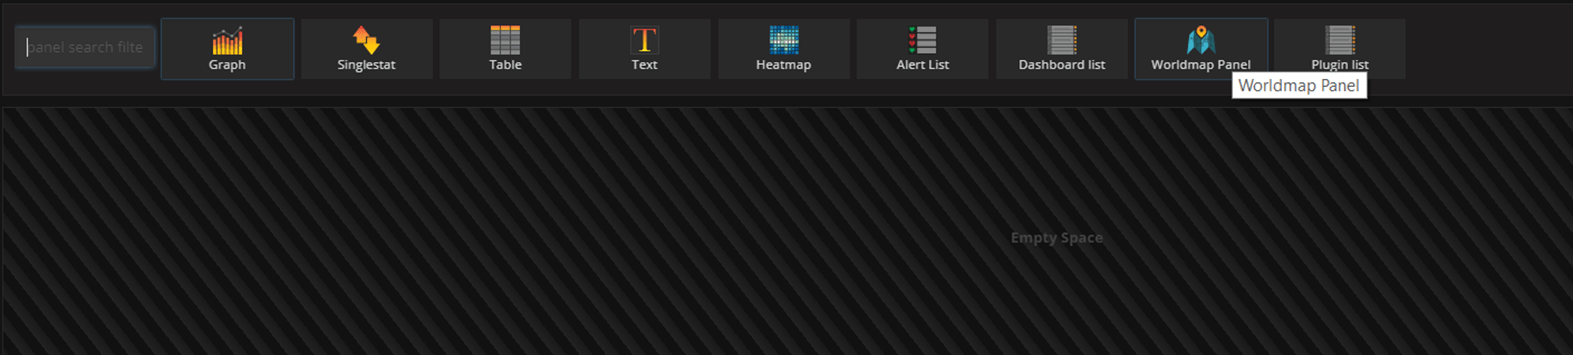
Once our data arrived, it’s time for visualization. Grafana is widely used to generate graphs and dashboards. To create a Weathermap we can use a Grafana plugin called Worldmap Panel. Make sure to install it using grafana-cli tool:

1
grafana-cli plugins install grafana-worldmap-panel

The plugin will be installed into your grafana plugins directory (/var/lib/grafana/plugins):

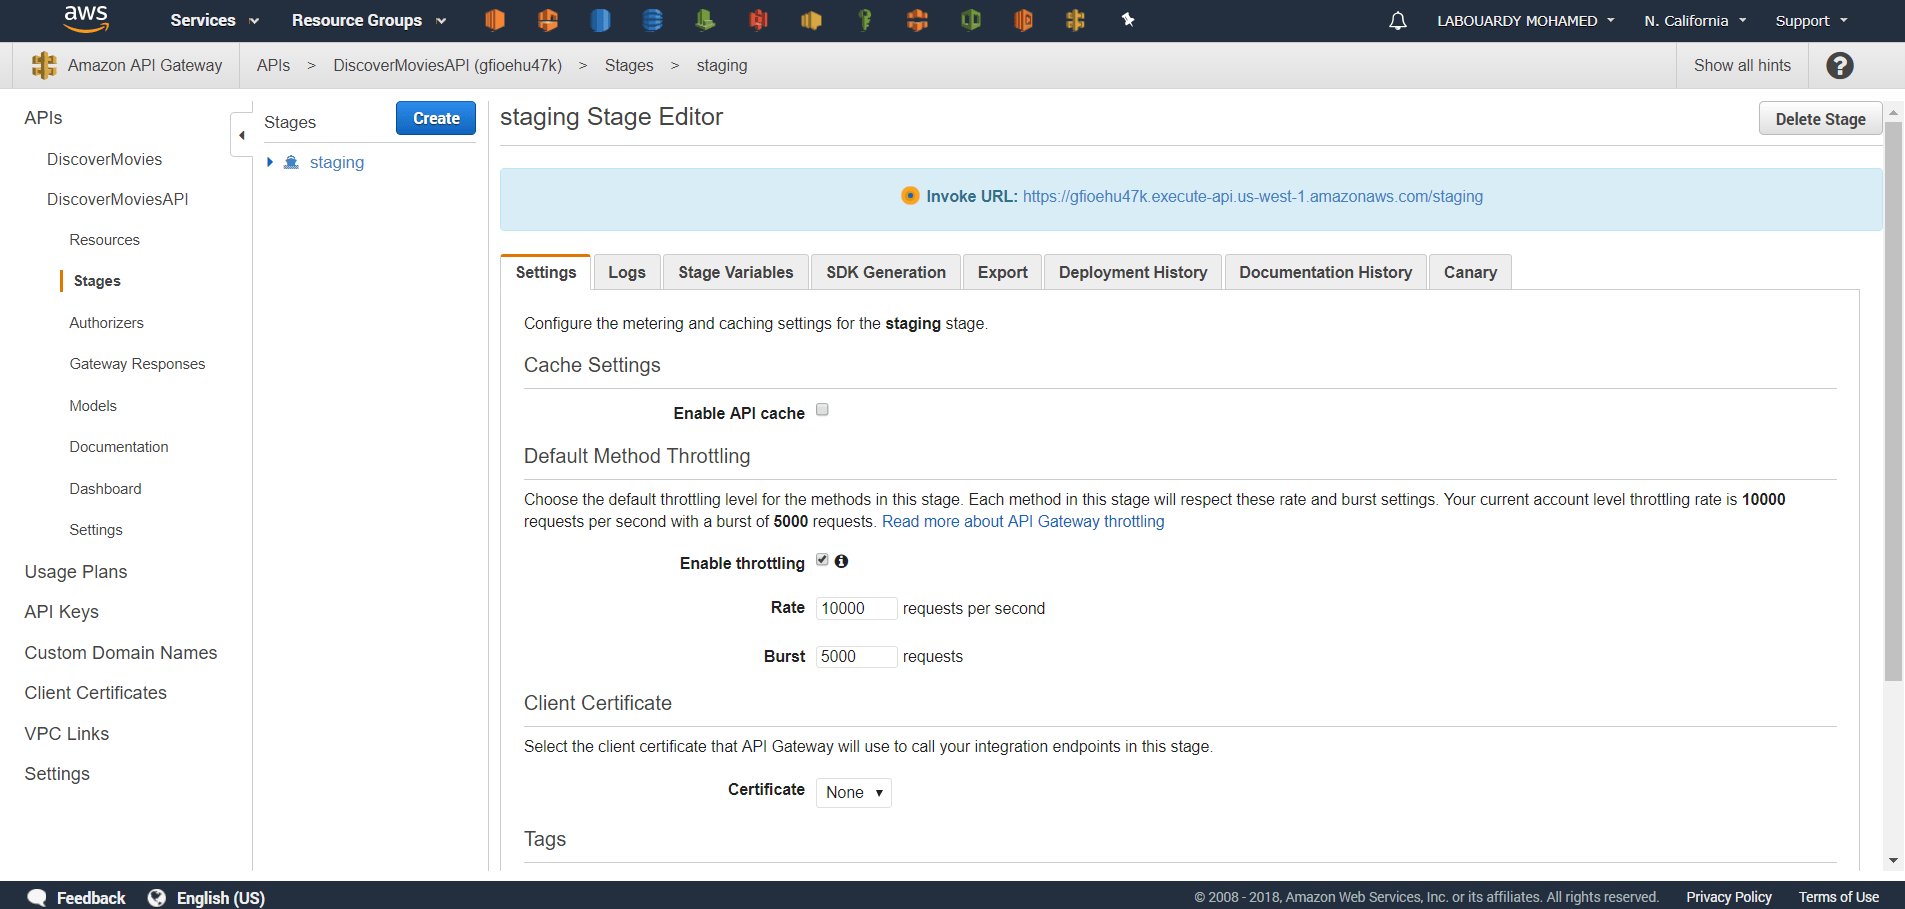
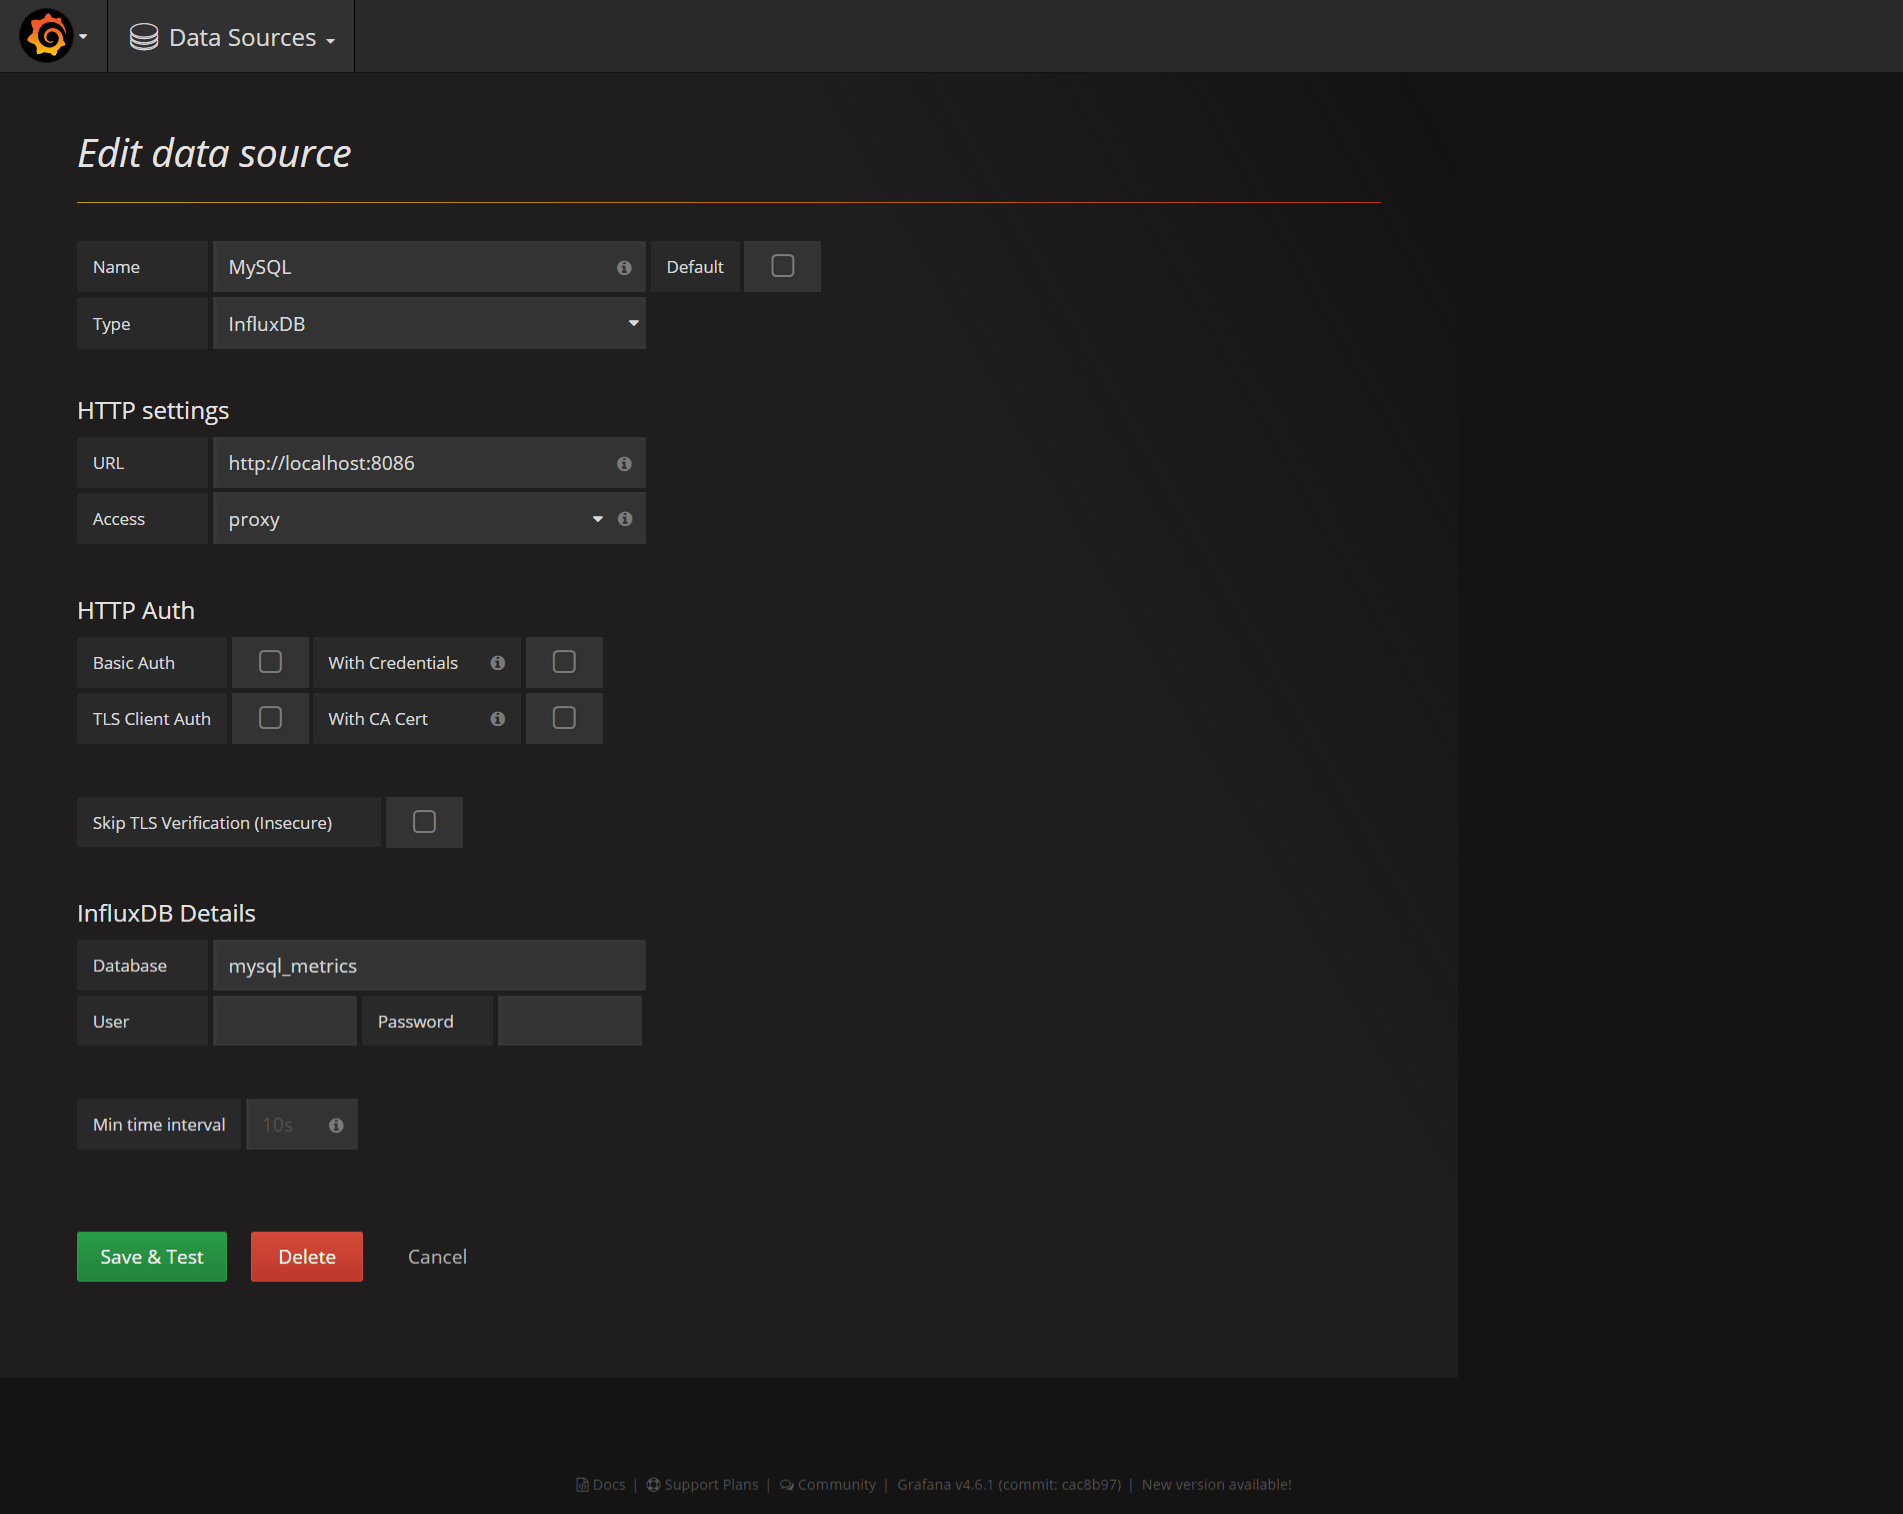
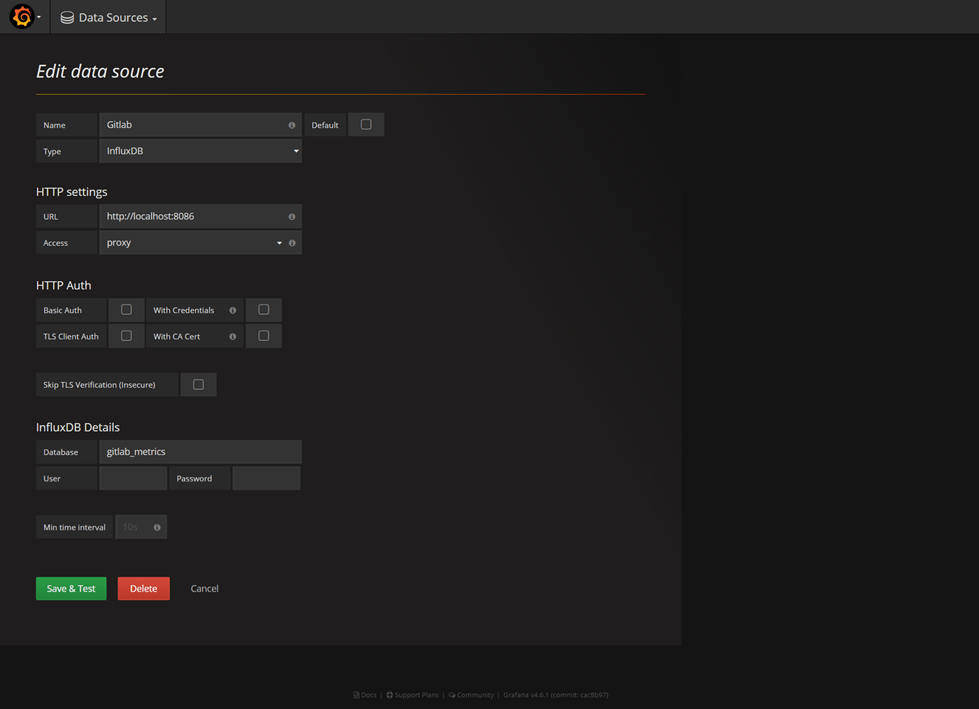
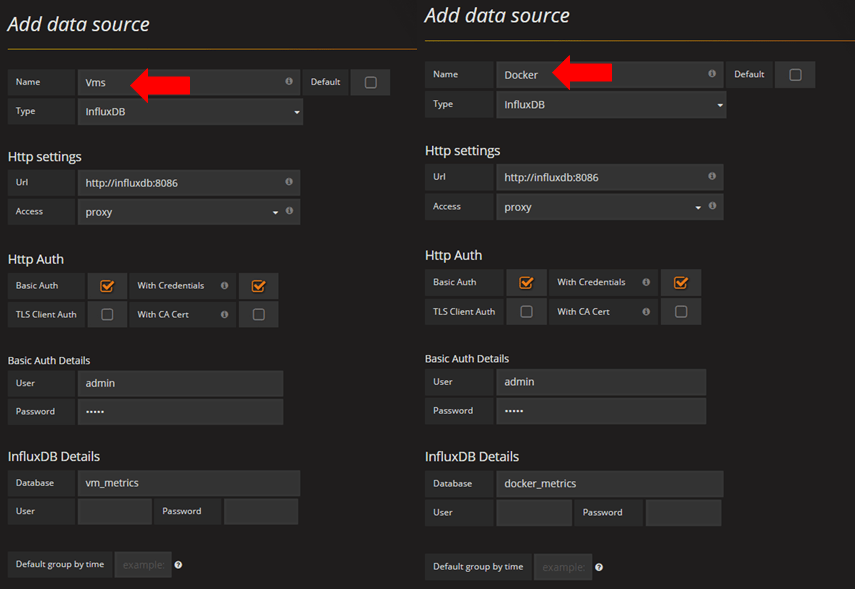
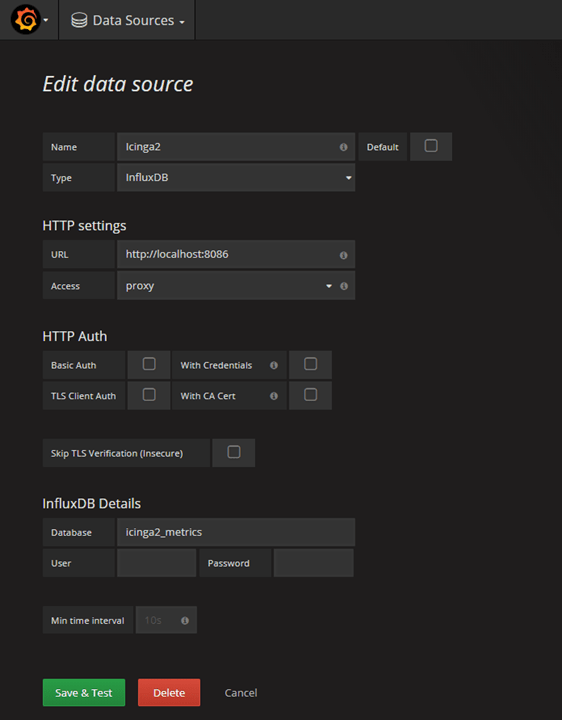
Restart Grafana, navigate to Grafana web interface and create a new datasource:


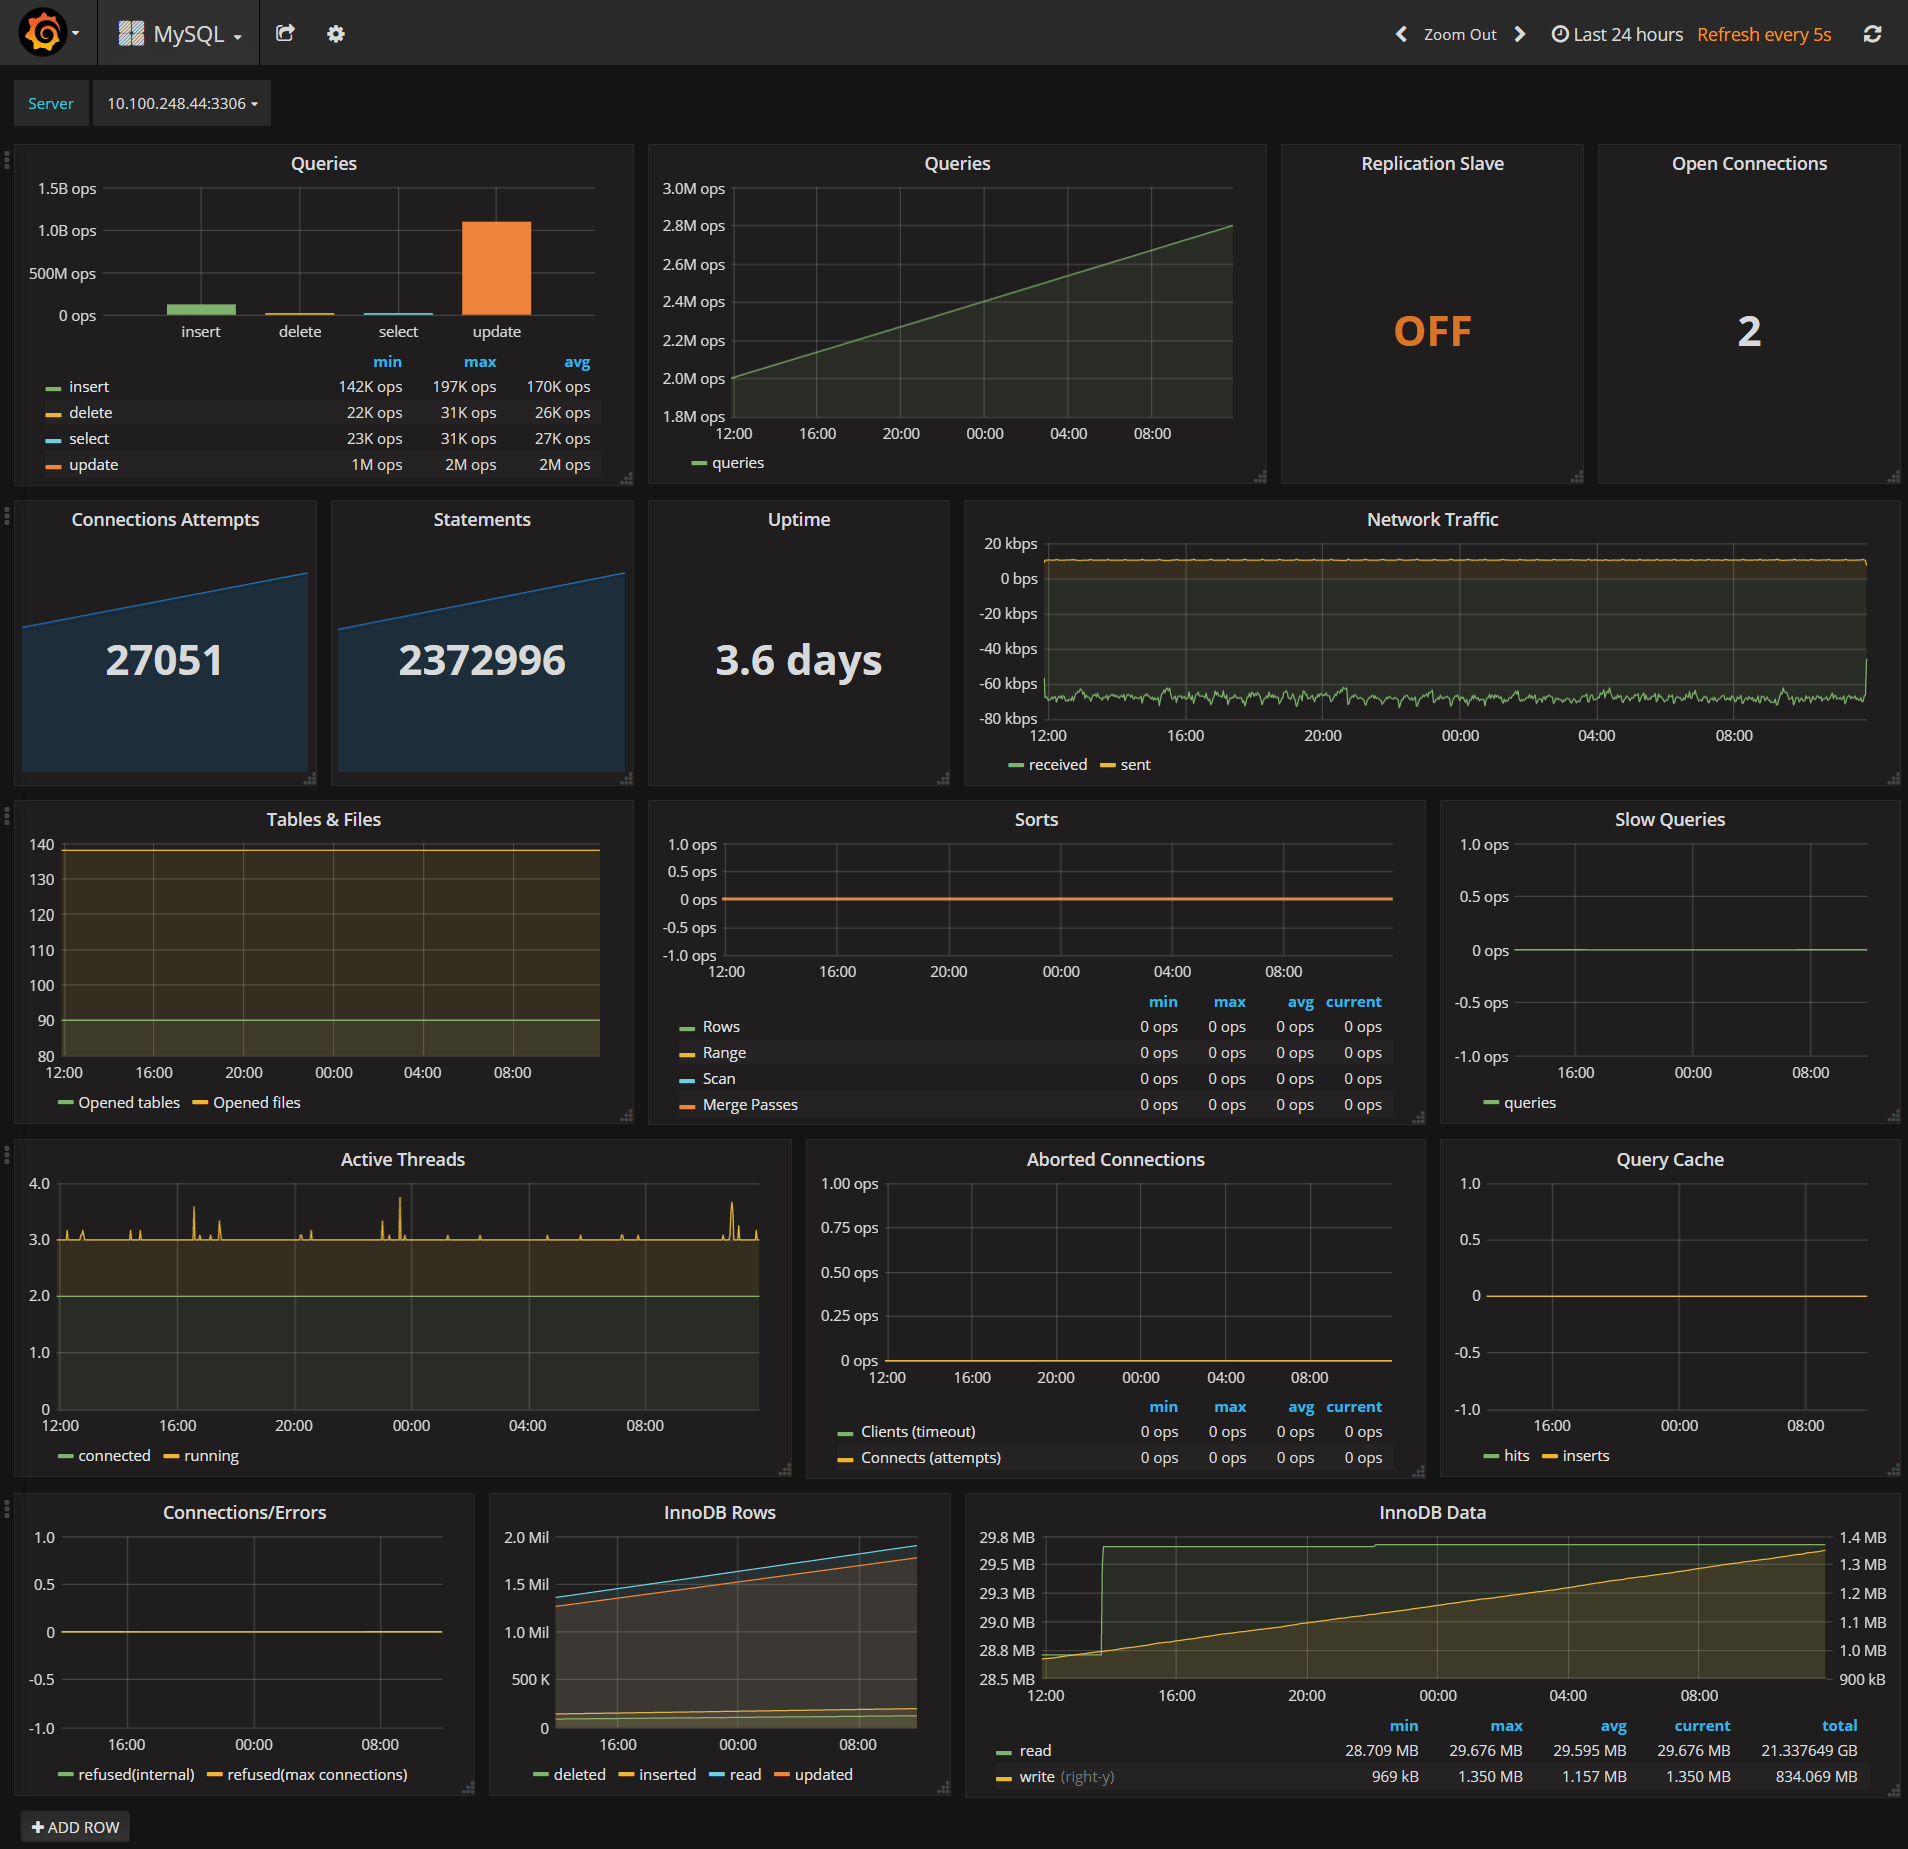
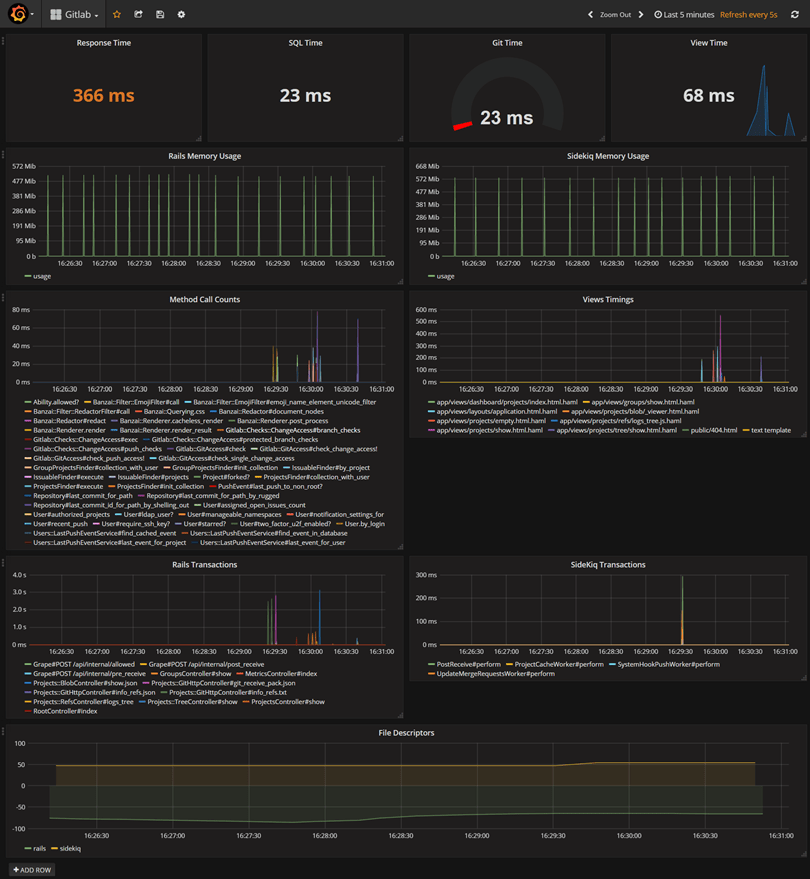
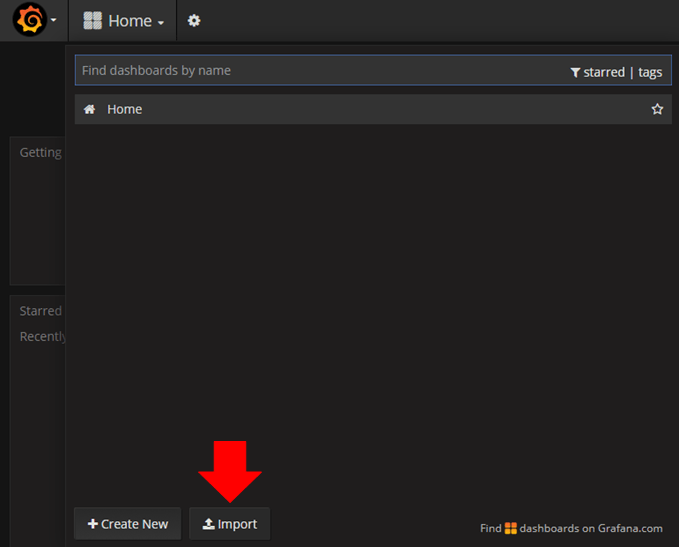
Create a new Dashboard:


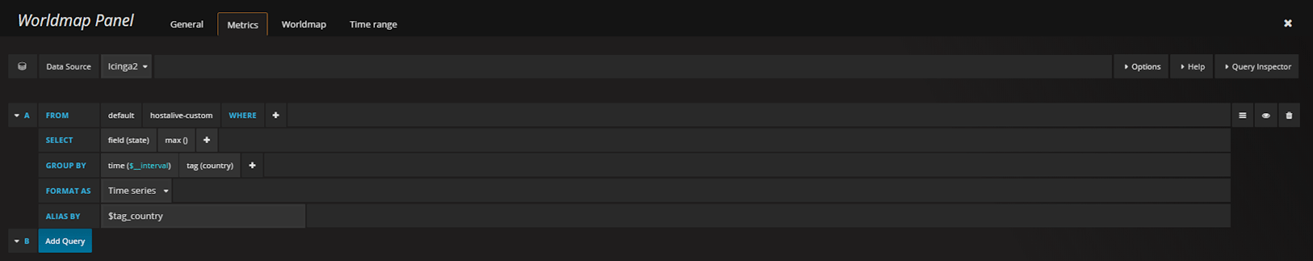
The Group By clause should be the country code and an alias is needed too. The alias should be in the form $tag_field_name. See the image below for an example of a query:


Under the Worldmap tab, choose the countries option:


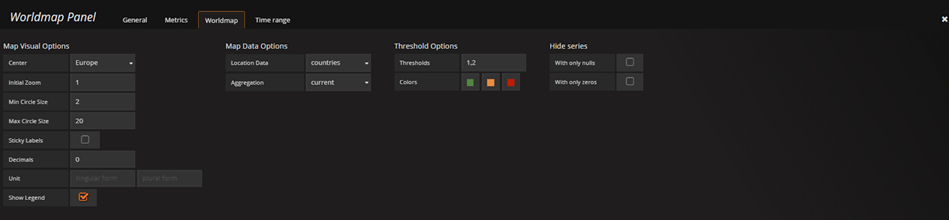
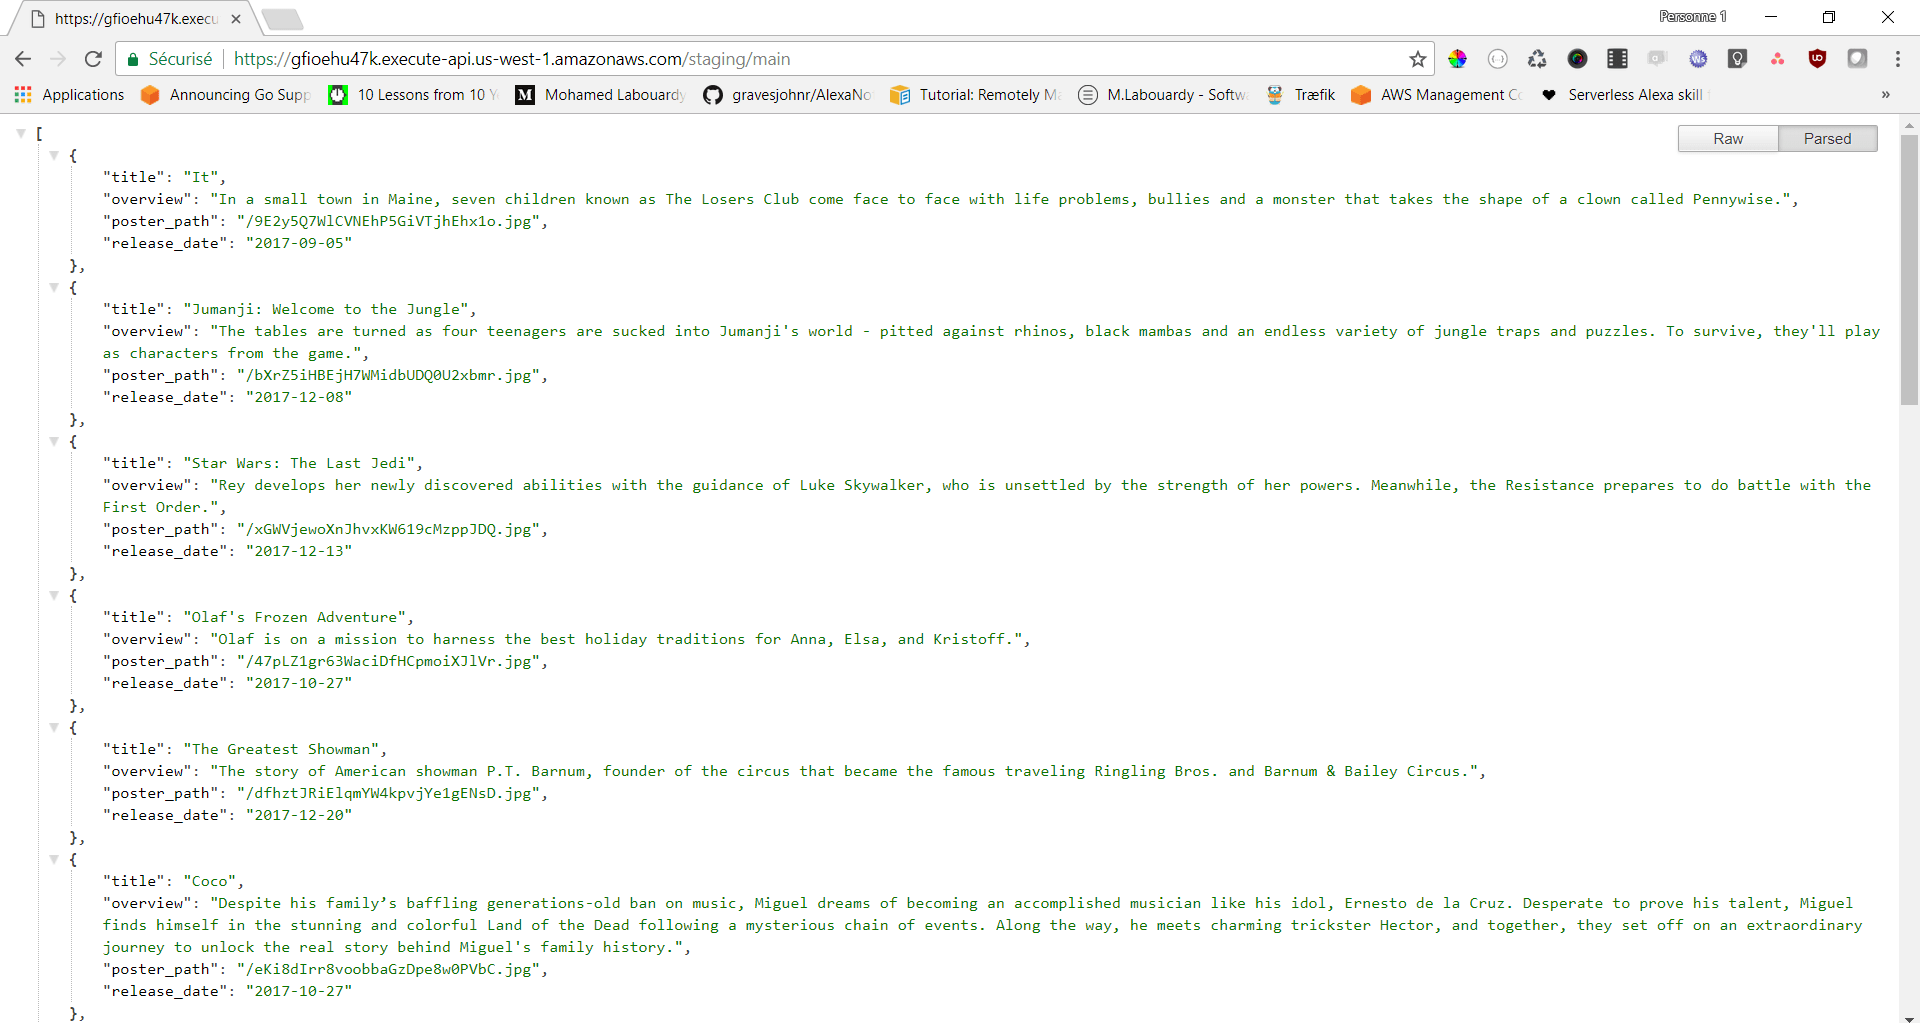
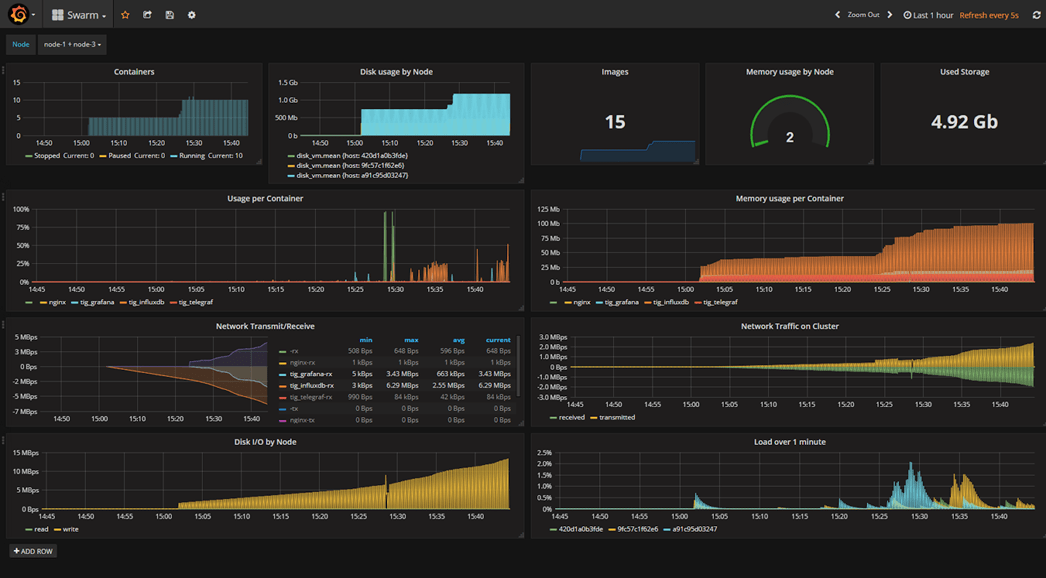
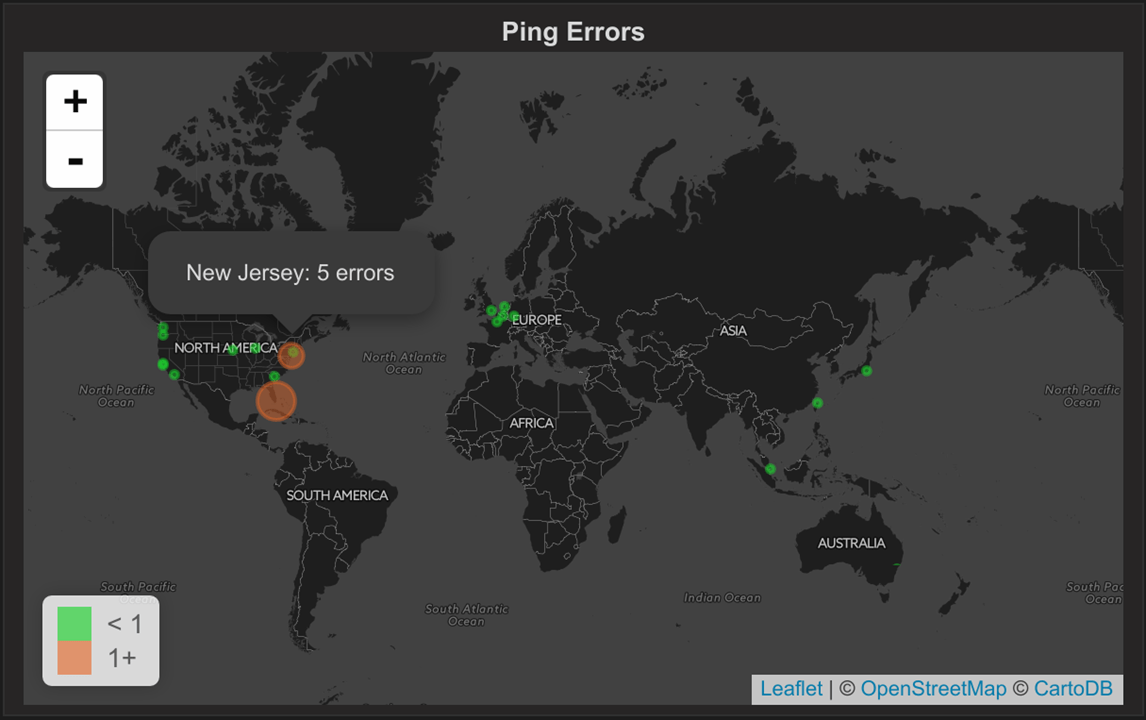
Finally, you should see a tile map of the world with circles representing the state of each host.


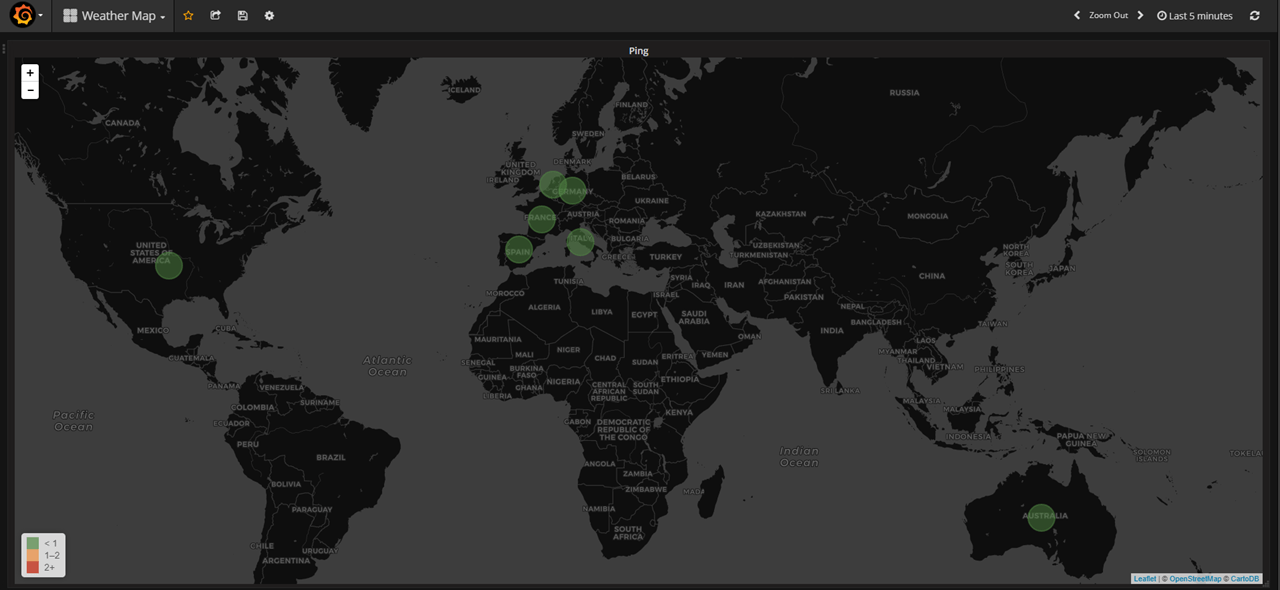
The field state possible values (0 – OK, 1 – Warning, 2 – Critical, 3 – Unknown/Unreachable)

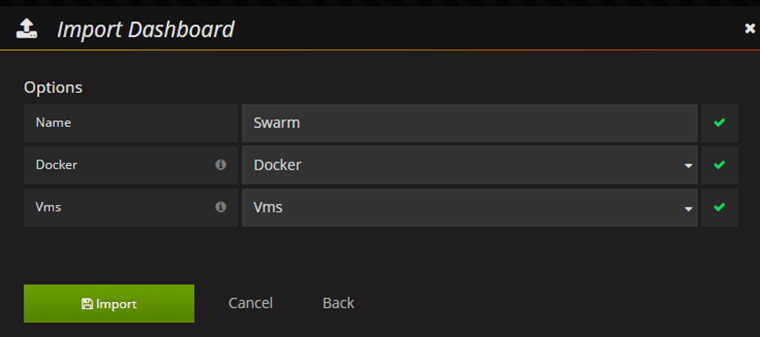
Note: For lazy people I created a ready to use Dashboard you can import from GitHub.

Drop your comments, feedback, or suggestions below — or connect with me directly on Twitter @mlabouardy.

AWS OpenVPN Access Server

Being able to access AWS resources directly in secure way can be very useful. To achieve this you can:

  • Setup a dedicated connection with AWS Direct Connect
  • Use a Network Appliance
  • Software Defined Private Network like OpenVPN

In this post, I will walk you through how to create an OpenVPN server on AWS, to connect securely to your VPC, Private Network resources and applications from any device anywhere.

To get started, sign in to your AWS Management Console and launch an EC2 instance from the OpenVPN Access Server AWS Marketplace offering:


For demo purpose, choose t2.micro:


Use the default settings with the exception of “Enable termination protection” as we dont want our VPN being terminated on accident:


Assign a new Security Group as below:


  • TCP – 22 : Remote access to the instance.
  • TCP – 443 : HTTPS, this is the interface used by users to log on to the VPN server and retrieve their keying and installation information.
  • TCP – 943 : OpenVPN Admin Web Dashboard.
  • UDP – 1194 : OpenVPN UDP Port.

To ensure our VPN instance Public IP address doesnt change if it’s stopped, assign to it an Elastic IP:


For simplicity, I added an A record in Route 53 which points to the instance Elastic IP:


Once the AMI is successfully launched, you will need to connect to the server via SSH using the DNS record:

1
ssh openvpnas@openvpn.slowcoder.com -i /path/to/key.pem

On first time connecting, you will be prompted and asked to setup the OpenVPN server:


Setup a new password for the openvpn admin user:

1
sudo passwd openvpn

Point your browser to https://openvpn.slowcoder.com, and login using openvpn credentials


Download the OpenVPN Connect Client, after your installation is complete, click on “Import” then “From server” :


Then type the OpenVN DNS name:


Enter your openvpn as the username and enter the same password as before and click on “connect“:


After you are connected, you should see a green check mark:


To verify the client is connected, login to OpenVPN Admin Dashboard on https://openvpn.slowcoder.com/admin :


Finally, create a simple web server instance in a private subnet to verify the VPN is working:


If you point your browser to the webserver private address, you should see a simple HTML page


Drop your comments, feedback, or suggestions below — or connect with me directly on Twitter @mlabouardy.

Serverless Golang API with AWS Lambda

AWS has announced few days ago, Go as supported language for AWS Lambda. So, I got my hand dirty and I made a Serverless Golang Lambda Function to discover new Movies by genres, I went even further and created a Frontend in top of my API with Angular 5.

Note: The full source code for this application can be found on GitHub


To get started, install the dependencies below:

1
2
go get github.com/aws/aws-lambda-go/lambda # for handler registration
go get github.com/stretchr/testify # for unit tests

Create a main.go file with the following code:

1
2
3
4
5
6
7
8
9
10
11
12
13
14
15
16
17
18
19
20
21
22
23
24
25
26
27
28
29
30
31
32
33
34
35
36
37
38
39
40
41
42
43
44
45
46
47
48
49
50
51
52
53
54
55
56
57
58
59
60
61
62
63
64
65
66
package main

import (
"encoding/json"
"errors"
"fmt"
"net/http"
"os"
"strconv"

"github.com/aws/aws-lambda-go/lambda"
)

var (
API_KEY = os.Getenv("API_KEY")
ErrorBackend = errors.New("Something went wrong")
)

type Request struct {
ID int `json:"id"`
}

type MovieDBResponse struct {
Movies []Movie `json:"results"`
}

type Movie struct {
Title string `json:"title"`
Description string `json:"overview"`
Cover string `json:"poster_path"`
ReleaseDate string `json:"release_date"`
}

func Handler(request Request) ([]Movie, error) {
url := fmt.Sprintf("https://api.themoviedb.org/3/discover/movie?api_key=%s", API_KEY)

client := &http.Client{}

req, err := http.NewRequest("GET", url, nil)
if err != nil {
return []Movie{}, ErrorBackend
}

if request.ID > 0 {
q := req.URL.Query()
q.Add("with_genres", strconv.Itoa(request.ID))
req.URL.RawQuery = q.Encode()
}

resp, err := client.Do(req)
if err != nil {
return []Movie{}, ErrorBackend
}
defer resp.Body.Close()

var data MovieDBResponse
if err := json.NewDecoder(resp.Body).Decode(&data); err != nil {
return []Movie{}, ErrorBackend
}

return data.Movies, nil
}

func main() {
lambda.Start(Handler)
}

The handler function takes as a parameter the movie genre ID then query the TMDb API – Awesome free API for Movies and TV Shows – to get list of movies. I registred the handler using the lambda.Start() method.

To test our handler before deploying it, we can create a basic Unit Test:

1
2
3
4
5
6
7
8
9
10
11
12
13
14
15
package main

import (
"testing"

"github.com/stretchr/testify/assert"
)

func TestHandler(t *testing.T) {
movies, err := Handler(Request{
ID: 28,
})
assert.IsType(t, nil, err)
assert.NotEqual(t, 0, len(movies))
}

Issue the following command to run the test:


Next, build an executable binary for Linux:

1
GOOS=linux go build -o main main.go

Zip it up into a deployment package:

1
zip deployment.zip main

Use the AWS CLI to create a new Lambda Function:

1
2
3
4
5
6
7
aws lambda create-function \
--region us-east-1 \
--function-name DiscoverMovies \
--zip-file fileb://./deployment.zip \
--runtime go1.x \
--role arn:aws:iam::<account-id>:role/<role> \
--handler main

Note: substitute role flag with your own IAM role.


Sign in to the AWS Management Console, and navigate to Lambda Dashboard, you should see your lambda function has been created:


Set TMDb API KEY (Sign up for an account) as environment variable:


Create a new test event:


Upon successful execution, view results in the console:


To provide the HTTPS frontend for our API, let’s add API Gateway as a trigger to the function:


Deployment:


Now, if you point your favorite browser to the Invoke URL:


Congratulations ! you have created your first Lambda function in Go.


Let’s build a quick UI in top of the API with Angular 5. Create an Angular project from scratch using Angular CLI. Then, generate a new Service to calls the API Gateway URL:

1
2
3
4
5
6
7
8
9
10
11
12
13
14
15
16
17
18
19
20
import { Injectable } from '@angular/core';
import { Http } from '@angular/http';
import { Observable } from 'rxjs/Rx';
import 'rxjs/add/operator/map';
import { environment } from '@env/environment';

@Injectable()
export class MovieService {
private baseUrl: string = environment.api;

constructor(private http: Http){}

public getMovies(id?: number){
return this.http
.post(`${this.baseUrl}`, {ID: id})
.map(res => {
return res.json()
})
}
}

In the main component iterate over the API response:

1
2
3
4
5
6
7
8
9
10
11
12
13
14
15
16
17
18
19
20
21
22
23
24
25
26
27
28
29
30
31
32
33
34
35
36
37
<section class="container">
<div class="row">
<div class="col-md-12">
<button *ngFor="let genre of genres" (click)="getMoviesByGenre(genre.id)" class="btn btn-secondary"></button>
</div>
</div>
<div class="row">
<div class="col-lg-12">
<table class="table table-hover">
<thead>
<tr>
<th>Poster</th>
<th width="20%">Title</th>
<th>Description</th>
<th>Release Date</th>
</tr>
</thead>
<tbody>
<tr *ngFor="let movie of movies">
<td>
<img src="https://image.tmdb.org/t/p/w500/" class="cover">
</td>
<td>
<span class="title"></span>
</td>
<td>
<p class="description"></p>
</td>
<td>
<span class="date"></span>
</td>
</tr>
</tbody>
</table>
</div>
</div>
</section>

Note: the full code is in GitHub.

Generate production grade artifacts:

1
ng build --env=prod


The build artifacts will be stored in the dist/ directory

Next, create an S3 bucket with AWS CLI:

1
aws s3 mb s3://discover-movies

Upload the build artifacts to the bucket:

1
aws s3 cp dist/ s3://discover-movies --recursive --grants read=uri=http://acs.amazonaws.com/groups/global/AllUsers

Finally, turns website hosting on for your bucket:

1
aws s3 website s3://discover-movies --index-document index.html

If you point your browser to the S3 Bucket URL, you should be happy:


Drop your comments, feedback, or suggestions below — or connect with me directly on Twitter @mlabouardy.

Real-Time Infrastructure Monitoring with Amazon Echo

Years ago, managing your infrastructure through voice was a science-fiction movie, but thanks to virtual assistants like Alexa it becomes a reality. In this post, I will show you how I was able to monitor my infrastructure on AWS using a simple Alexa Skill.


At a high level, the architecture of the skill is as follows:

I installed data collector agent (Telegraf) in each EC2 instance to collect metrics about system usage (disk, memory, cpu ..) and send them to a time-series database (InfluxDB)

Once my database is populated with metrics, Amazon echo will transform my voice commands to intents that will trigger a Lambda function, which will use the InfluxDB REST API to query the database.


Enough with talking, lets build this skill from scratch, clone the following GitHub repository:

1
git clone https://github.com/mlabouardy/alexa-monitor

Create a simple fleet of EC2 instances using Terraform. Install the AWS provider:

1
terraform init

Set your own AWS credentials in variables.tfvars. Create an execution plan:

1
terraform plan --var-file=variables.tfvars

Provision the infrastructure:

1
terraform apply --var-file=variables.tfvars

You should see the IP address for each machine:


Login to AWS Management Console, you should see your nodes has been created successfully:


To install Telegraf on each machine, I used Ansible, update the ansible/inventory with your nodes IP addresses as follows:

1
2
3
4
5
6
7
8
[nodes]
35.178.10.226 hostname=Rabat
35.177.164.157 hostname=Paris
52.56.126.138 hostname=London

[nodes:vars]
remote_user=ec2-user
influxdb_ip=35.177.123.180

Execute the playbook:

1
ansible-playbook -i inventory playbook.yml --private-key=key.pem


If you connect via SSH to one of the server, you should see the Telegraf agent is running as Docker container:


In few seconds the InfluxDB database will be populated with some metrics:


Sign in to the Amazon Developer Portal, create a new Alexa Skill:


Create an invocation name – aws – This is the word that will trigger the Skill.

In the Intent Schema box, paste the following JSON code:

1
2
3
4
5
6
7
8
9
10
11
12
13
14
15
16
17
{
"intents" : [
{
"intent" : "GetSystemUsage",
"slots" : [
{
"name" : "Metric",
"type" : "TYPE_OF_METRICS"
},
{
"name" : "City",
"type" : "LIST_OF_CITIES"
}
]
}
]
}

Create a new slot types to store the type of metric and machine hostname:

1
2
3
4
5
6
7
8
9
10
11
TYPE_OF_METRICS:

CPU
DISK
MEMORY

LIST_OF_CITIES:

Paris
Rabat
London

Under Uterrances, enter all the phrases that you think you might say to interact with the skill

1
GetSystemUsage {Metric} usage of machine in {City}


Click on “Next” and you will move onto a page that allows us to use an ARN (Amazon Resource Name) to link to AWS Lambda.

Before that, let’s create our lambda function, go to AWS Management Console and create a new lambda function from scratch:


Note: Select US East (N.Virginia), which is a supported region for Alexa Skill Kit.

Make sure the trigger is set to Alexa Skills Kit, then select Next.

The code provided uses the InfluxDB client to fetch metrics from database.

1
2
3
4
5
6
7
8
9
10
11
12
13
14
15
16
17
18
19
20
function MetricsDB(){
this.influx = new Influx.InfluxDB({
host: process.env.INFLUXDB_HOST,
database: process.env.INFLUXDB_DATABASE
})
}

MetricsDB.prototype.getCPU = function(machine, callback){
this.influx.query(`
SELECT last(usage_system) AS system, last(usage_user) AS "user"
FROM cpu
WHERE time > now() - 5m AND host='${machine}'
`).then(result => {
var system_usage = result[0].system.toFixed(2)
var user_usage = result[0].user.toFixed(2)
callback(`System usage is ${system_usage} percent & user usage is ${user_usage} percent`)
}).catch(err => {
callback(`Cannot get cpu usage values`)
})
}

Specify the .zip file name as your deployment package at the time you create the Lambda function. Don’t forget to set the InfluxDB Hostname & Database name as an environment variables:


Then go to the Configuration step of your Alexa Skill in the Amazon Developer Console and enter the Lambda Function ARN:


Click on “Next“. Under the “Service Simulator” section, you’ll be able to enter a sample utterance to trigger your skill:

Memory Usage


Disk usage:


CPU usage:


Test your skill on your Amazon Echo, Echo Dot, or any Alexa device by saying, “Alexa, ask AWS for disk usage of machine in Paris

Drop your comments, feedback, or suggestions below — or connect with me directly on Twitter @mlabouardy.

Butler CLI:Export/Import Jenkins Plugins & Jobs

Not long ago, I had to migrate Jenkins jobs from an old server to a new one. That’s where StackOverflow comes into the play, below the most voted answers I found:

  • Jenkins CLI
  • Copy the jobs directory
  • Jenkins Remote API
  • Jenkins Job Import Plugin

In spite of their advantages, those solutions comes with their downsides especially if you have a large number of jobs to move or no access root to the server. But, guess what ? I didn’t stop there. I have came up with a CLI to make your life easier and export/import not only Jenkins jobs but also plugins like a boss.

To get started, find the appropriate package for your system and download it. For linux:

1
2
3
wget https://s3.us-east-1.amazonaws.com/butlercli/1.0.0/linux/butler
chmod +x butler
mv butler /usr/local/bin/

Note: For Windows make sure that butler binary is available on the PATH. This page contains instructions for setting the PATH on Windows.

Once done, verify the installation worked, by opening a new terminal session and checking if butler is available :

1
butler help


1 – Plugins Management

To export Jenkins jobs, you need to provide the URL of the source Jenkins instance:

1
butler plugins export --server localhost:8080 --username admin --password admin


As shown above, butler will dump a list of plugins installed to stdout and a new file plugins.txt will be generated, with list of installed Jenkins plugins with name and version pairs:

1
2
3
4
5
6
7
8
9
10
11
12
13
14
15
16
17
18
19
20
21
22
23
24
25
26
27
28
29
30
31
32
33
34
35
36
37
38
39
bouncycastle-api@2.16.2
structs@1.10
script-security@1.39
scm-api@2.2.6
workflow-step-api@2.14
workflow-api@2.24
workflow-support@2.16
durable-task@1.17
workflow-durable-task-step@2.17
credentials@2.1.16
ssh-credentials@1.13
plain-credentials@1.4
credentials-binding@1.13
gradle@1.28
pipeline-input-step@2.8
apache-httpcomponents-client-4-api@4.5.3-2.0
junit@1.23
windows-slaves@1.3.1
display-url-api@2.2.0
mailer@1.20
matrix-auth@2.2
antisamy-markup-formatter@1.5
matrix-project@1.12
jsch@0.1.54.1
git-client@2.7.0
pam-auth@1.3
authentication-tokens@1.3
docker-commons@1.11
ace-editor@1.1
jquery-detached@1.2.1
workflow-scm-step@2.6
workflow-cps@2.42
docker-workflow@1.14
jackson2-api@2.8.10.1
github-api@1.90
git@3.7.0
workflow-job@2.12.2
token-macro@2.3
github@1.28.1

Now, to import the plugins to the new Jenkins instance, use the command below with the URL of the Jenkins target instance as an argument:

1
butler plugins import --server localhost:8080 --username admin --password admin


Butler will install each plugin on the target Jenkins instance by issuing API calls.

2 – Jobs Management


To export Jenkins jobs, just provide the URL of the source Jenkins server:

1
butler jobs export --server localhost:8080 --username admin --password admin


A new directory jobs/ will be created with every job in Jenkins. Each job will have its own configuration file config.xml.


Now, to import the jobs to the new Jenkins instance, issue the following command:


1
butler jobs import --server localhost:8080 --username admin --password admin


Butler will use the configuration files created earlier to issue API calls to target Jenkins instance to create jobs.

Once you are done, check Jenkins and you should see your jobs successfully created :


Hope it helps ! The CLI is still in its early stages, so you are welcome to contribute to the project in GitHub.

Drop your comments, feedback, or suggestions below — or connect with me directly on Twitter @mlabouardy.

MySQL Monitoring with Telegraf, InfluxDB & Grafana

This post will walk you through each step of creating interactive, real-time & dynamic dashboard to monitor your MySQL instances using Telegraf, InfluxDB & Grafana.

Start by enabling the MySQL input plugin in /etc/telegraf/telegraf.conf :

1
2
3
4
5
6
7
8
[[inputs.mysql]]
servers = ["root:root@tcp(localhost:3306)/?tls=false"]
name_suffix = "_mysql"

[[outputs.influxdb]]
database = "mysql_metrics"
urls = ["http://localhost:8086"]
namepass = ["*_mysql"]

Once Telegraf is up and running it’ll start collecting data and writing them to the InfluxDB database:


Finally, point your browser to your Grafana URL, then login as the admin user. Choose ‘Data Sources‘ from the menu. Then, click ‘Add new‘ in the top bar.

Fill in the configuration details for the InfluxDB data source:


You can now import the dashboard.json file by opening the dashboard dropdown menu and click ‘Import‘ :


Note: Check my GitHub for more interactive & beautiful Grafana dashboards.

Drop your comments, feedback, or suggestions below — or connect with me directly on Twitter @mlabouardy.

GitLab Performance Monitoring with Grafana

Since GitLab v8.4 you can monitor your own instance with InfluxDB & Grafana stack by using the GitLab application performance measuring system called “Gitlab Performance Monitoring“.

GitLab writes metrics to InfluxDB via UDP. Therefore, this must be enabled in /etc/influxdb/influxdb.conf:

1
2
3
4
5
6
7
8
9
10
11
12
13
14
15
16
17
18
19
[meta]
dir = "/var/lib/influxdb/meta"

[data]
dir = "/var/lib/influxdb/data"
engine = "tsm1"
wal-dir = "/var/lib/influxdb/wal"

[admin]
enabled = true

[[udp]]
enabled = true
bind-address = ":8089"
database = "gitlab_metrics"
batch-size = 1000
batch-pending = 5
batch-timeout = "1s"
read-buffer = 209715200

Restart your InfluxDB instance. Then, create a database to store GitLab metrics:

1
CREATE DATABASE "gitlab_metrics"

Next, go to Gitlab Setings Dashboard and enable InfluxDB Metrics as shown below:


Then, you need to restart GitLab:

1
gitlab-ctl restart

Now your GitLab instance should send data to InfluxDB:


Finally, Point your browser to your Grafana URL, then login as the admin user. Choose ‘Data Sources‘ from the menu. Then, click ‘Add new‘ in the top bar.

Fill in the configuration details for the InfluxDB data source:


You can now import the dashboard.json file by opening the dashboard dropdown menu and click ‘Import‘ :


Note: Check my GitHub for more interactive & beautiful Grafana dashboards.

Drop your comments, feedback, or suggestions below — or connect with me directly on Twitter @mlabouardy.

Exploring Swarm & Container Overview Dashboard in Grafana

In my previous post, your learnt how to monitor your Swarm Cluster with TICK Stack. In this part, I will show you how to use the same Stack but instead of using Chronograf as our visualization and exploration tool we will use Grafana.

Connect to your manager node via SSH, and clone the following GitHub repository:

1
git clone https://github.com/mlabouardy/swarm-tig.git

Use the docker-compose.yml below to setup the monitoring stack:

1
2
3
4
5
6
7
8
9
10
11
12
13
14
15
16
17
18
19
20
21
22
23
24
25
26
27
28
29
30
31
32
33
34
35
36
37
38
39
40
41
42
43
44
45
46
47
48
49
version: "3.3"

services:
telegraf:
image: telegraf:1.3
networks:
- tig-net
volumes:
- /var/run/docker.sock:/var/run/docker.sock
configs:
- source: telegraf-config
target: /etc/telegraf/telegraf.conf
deploy:
restart_policy:
condition: on-failure
mode: global

influxdb:
image: influxdb:1.2
networks:
- tig-net
deploy:
restart_policy:
condition: on-failure
placement:
constraints:
- node.role == worker

grafana:
container_name: grafana
image: grafana/grafana:4.3.2
ports:
- "3000:3000"
networks:
- tig-net
deploy:
restart_policy:
condition: on-failure
placement:
constraints:
- node.role == manager

configs:
telegraf-config:
file: $PWD/conf/telegraf/telegraf.conf

networks:
tig-net:
driver: overlay

Then, issue the following command to deploy the stack:

1
docker stack deploy --compose-file docker-compose.yml tig

Once deployed, you should see the list of services running on the cluster:


Point your browser to http://IP:3000, you should be able to reach the Grafana Dashboard:


The default username & password are admin. Go ahead and log in.

Go to “Data Sources” and create 2 InfluxDB data sources:

  • Vms: pointing to your Cluster Nodes metrics database.
  • Docker: pointing to your Docker Services metrics database.


Finally, import the dashboard by hitting the “import” button:


From here, you can upload the dashboard.json, then pick the data sources you created earlier:


You will end up with an interactive and dynamic dashboard:


Drop your comments, feedback, or suggestions below — or connect with me directly on Twitter @mlabouardy.

DialogFlow (API.AI) Golang SDK

DialogFlow (formerly API.AI) gives users new ways to interact with your bot by building engaging voice and text-based conversational interfaces powered by AI.

DialogFlow offers many SDKs in different programming languages:


But unfortunately, there’s no SDK for Golang


But dont be sad, I made an SDK to integrate DialogFlow with Golang:


This library allows integrating agents from the DialogFlow natural language processing service with your Golang application.

Issue the following command to install the library:

1
go get github.com/mlabouardy/dialogflow-go-client

The example below, display list of entities:

1
2
3
4
5
6
7
8
9
10
11
12
13
14
15
16
17
18
19
20
21
22
23
24
25
package main

import (
"fmt"
"github.com/mlabouardy/dialogflow-go-client"
"github.com/mlabouardy/dialogflow-go-client/models"
"log"
)

func main() {
err, client := NewDialogFlowClient(Options{
AccessToken: "<DIALOGFLOW TOKEN GOES HERE>",
})
if err != nil {
log.Fatal(err)
}

entities, err := client.EntitiesFindAllRequest()
if err != nil {
log.Fatal(err)
}
for _, entity := range entities {
fmt.Println(entity.Name)
}
}

Note: for more details about the available methods, check the project GitHub repository.

For a real world example on how to use this library, check my previous tutorial, on how to create a Messenger Bot in Golang to show list of movies playing in cinema, and tv shows airing on TV:


Drop your comments, feedback, or suggestions below — or connect with me directly on Twitter @mlabouardy.

Generate beautiful Swagger API documentation from Insomnia

I recently built a tool called Swaggymnia to generate Swagger documentation for an existing API in Insomnia REST client. So brace yourself for a short but interesting quick tip read.

Start by downloading Swaggymnia, find the appropriate package for your system and download it. For linux:

1
wget https://s3.amazonaws.com/swaggymnia/1.0.0-beta/linux/swaggymnia

After downloading Swaggymnia. Add the execution permission to the binary:

1
chmod +x swaggymnia


Note: For Windows make sure that swaggymnia binary is available on the PATH. This page contains instructions for setting the PATH on Windows.

After installing, verify the installation worked, by opening a new terminal session and checking if swaggymnia is available :


Once done, export your API from Insomnia:


Next, create a configuration file with the format below:

1
2
3
4
5
6
7
8
{
"title" : "API Name",
"version" : "API version",
"host" : "API URL",
"bastPath" : "Base URL",
"schemes" : "HTTP protocol",
"description" : "API description"
}

Then, issue the following command:

1
swaggymnia generate -i watchnow.json -c config.json -o yaml

As result, you should see a new file called swagger.yml generated:


Now our Swagger spec is generated, you can publish your Swagger spec as customer-facing documentation.


For this purpose you can use Swagger UI, which converts your Swagger spec into a beautiful, interactive API documentation.

You can download Swagger UI from here. It is just a bundle of HTML, CSS and JS files, which doesn’t require a framework or anything, so they can be installed in a directory on any HTTP server.

Once you have downloaded it, you put your swagger.yaml file into the dist directory — and open index.html and change it to point at your swagger file instead of http://petstore.swagger.io/v2/swagger.json.

Then you can open index.html in your browser, and see your new beautiful, interactive API documentation:


Make sure to drop your comments, feedback, or suggestions below — or connect with me directly on Twitter @mlabouardy

Your browser is out-of-date!

Update your browser to view this website correctly. Update my browser now

×