AWS CloudWatch Monitoring with Grafana

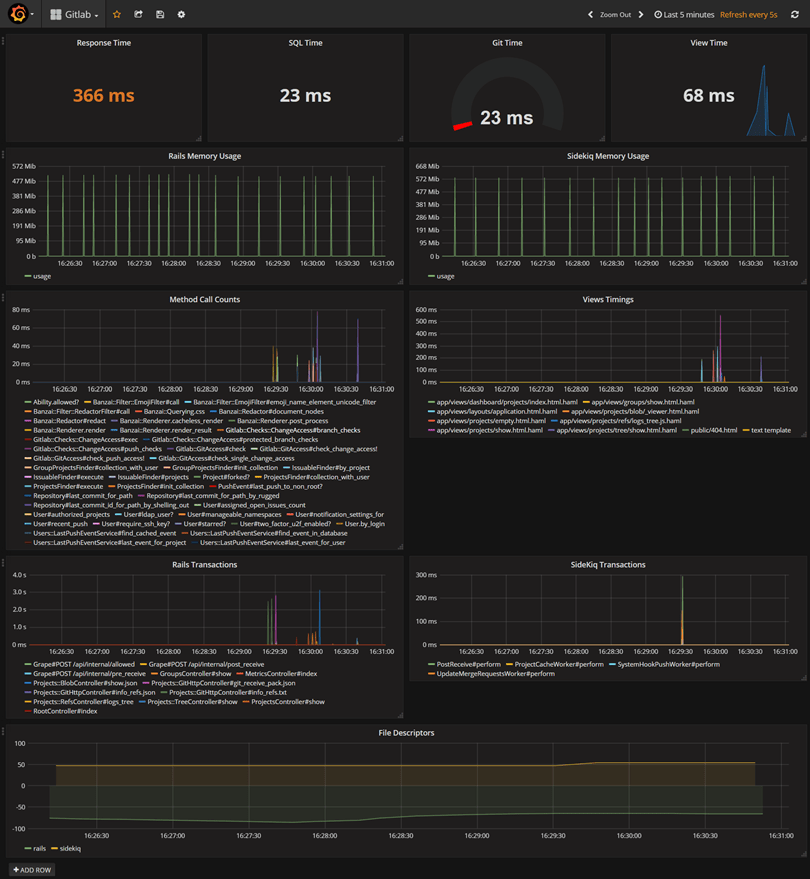
Hybrid cloud is the new reality. Therefore, you will need a single tool, general purpose dashboard and graph composer for your global infrastructure. That’s where Grafana comes into play. Due to it’s pluggable architecture, you have access to many widgets and plugins to create interactive & user-friendly dashboards. In this post, I will walk you through on how to create dashboards in Grafana to monitor in real-time your EC2 instances based on metrics collected in AWS CloudWatch.

To get started, create an IAM role with the following IAM policy:

1
2
3
4
5
6
7
8
9
10
11
12
13
14
15
16
{
"Version": "2012-10-17",
"Statement": [
{
"Sid": "1",
"Effect": "Allow",
"Action": [
"cloudwatch:PutMetricData",
"cloudwatch:GetMetricStatistics",
"cloudwatch:GetMetricData",
"cloudwatch:ListMetrics"
],
"Resource": "*"
}
]
}

Launch an EC2 instance with the user-data script below. Make sure to associate to the instance the role we created earlier:

1
2
3
4
#!/bin/sh
yum install -y https://s3-us-west-2.amazonaws.com/grafana-releases/release/grafana-5.0.3-1.x86_64.rpm
service grafana-server start
/sbin/chkconfig --add grafana-server

On the security group section, allow inbound traffic on port 3000 (Grafana Dashboard).

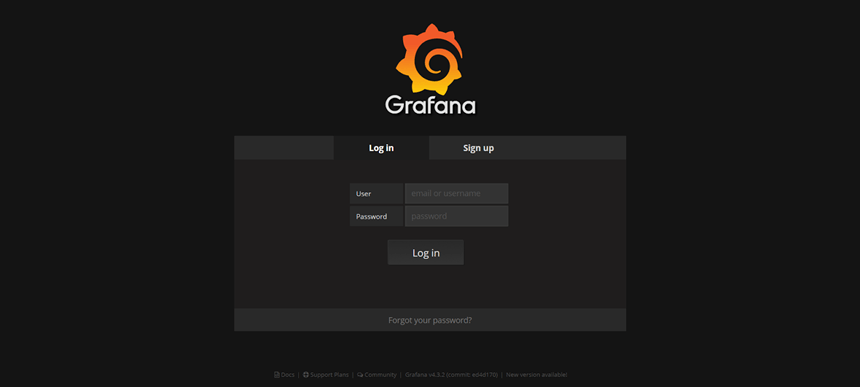
Once created, point your browser to the http://instance_dns_name:3000, you should see Grafana Login page (default credentials: admin/admin) :


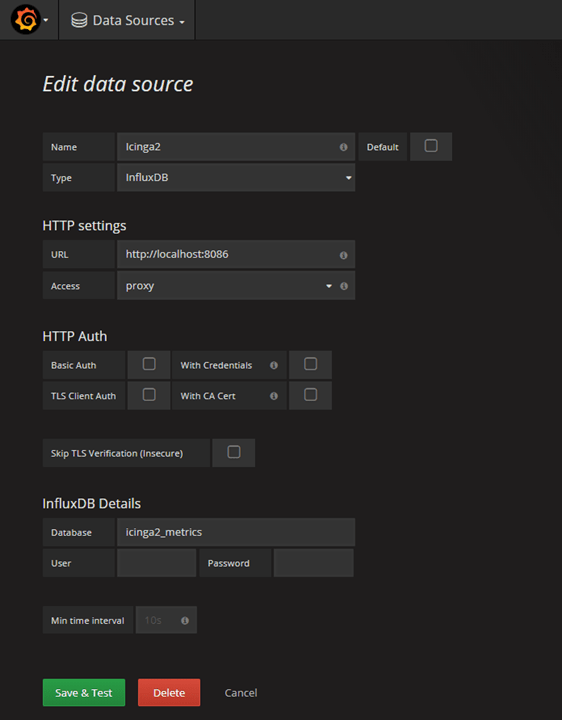
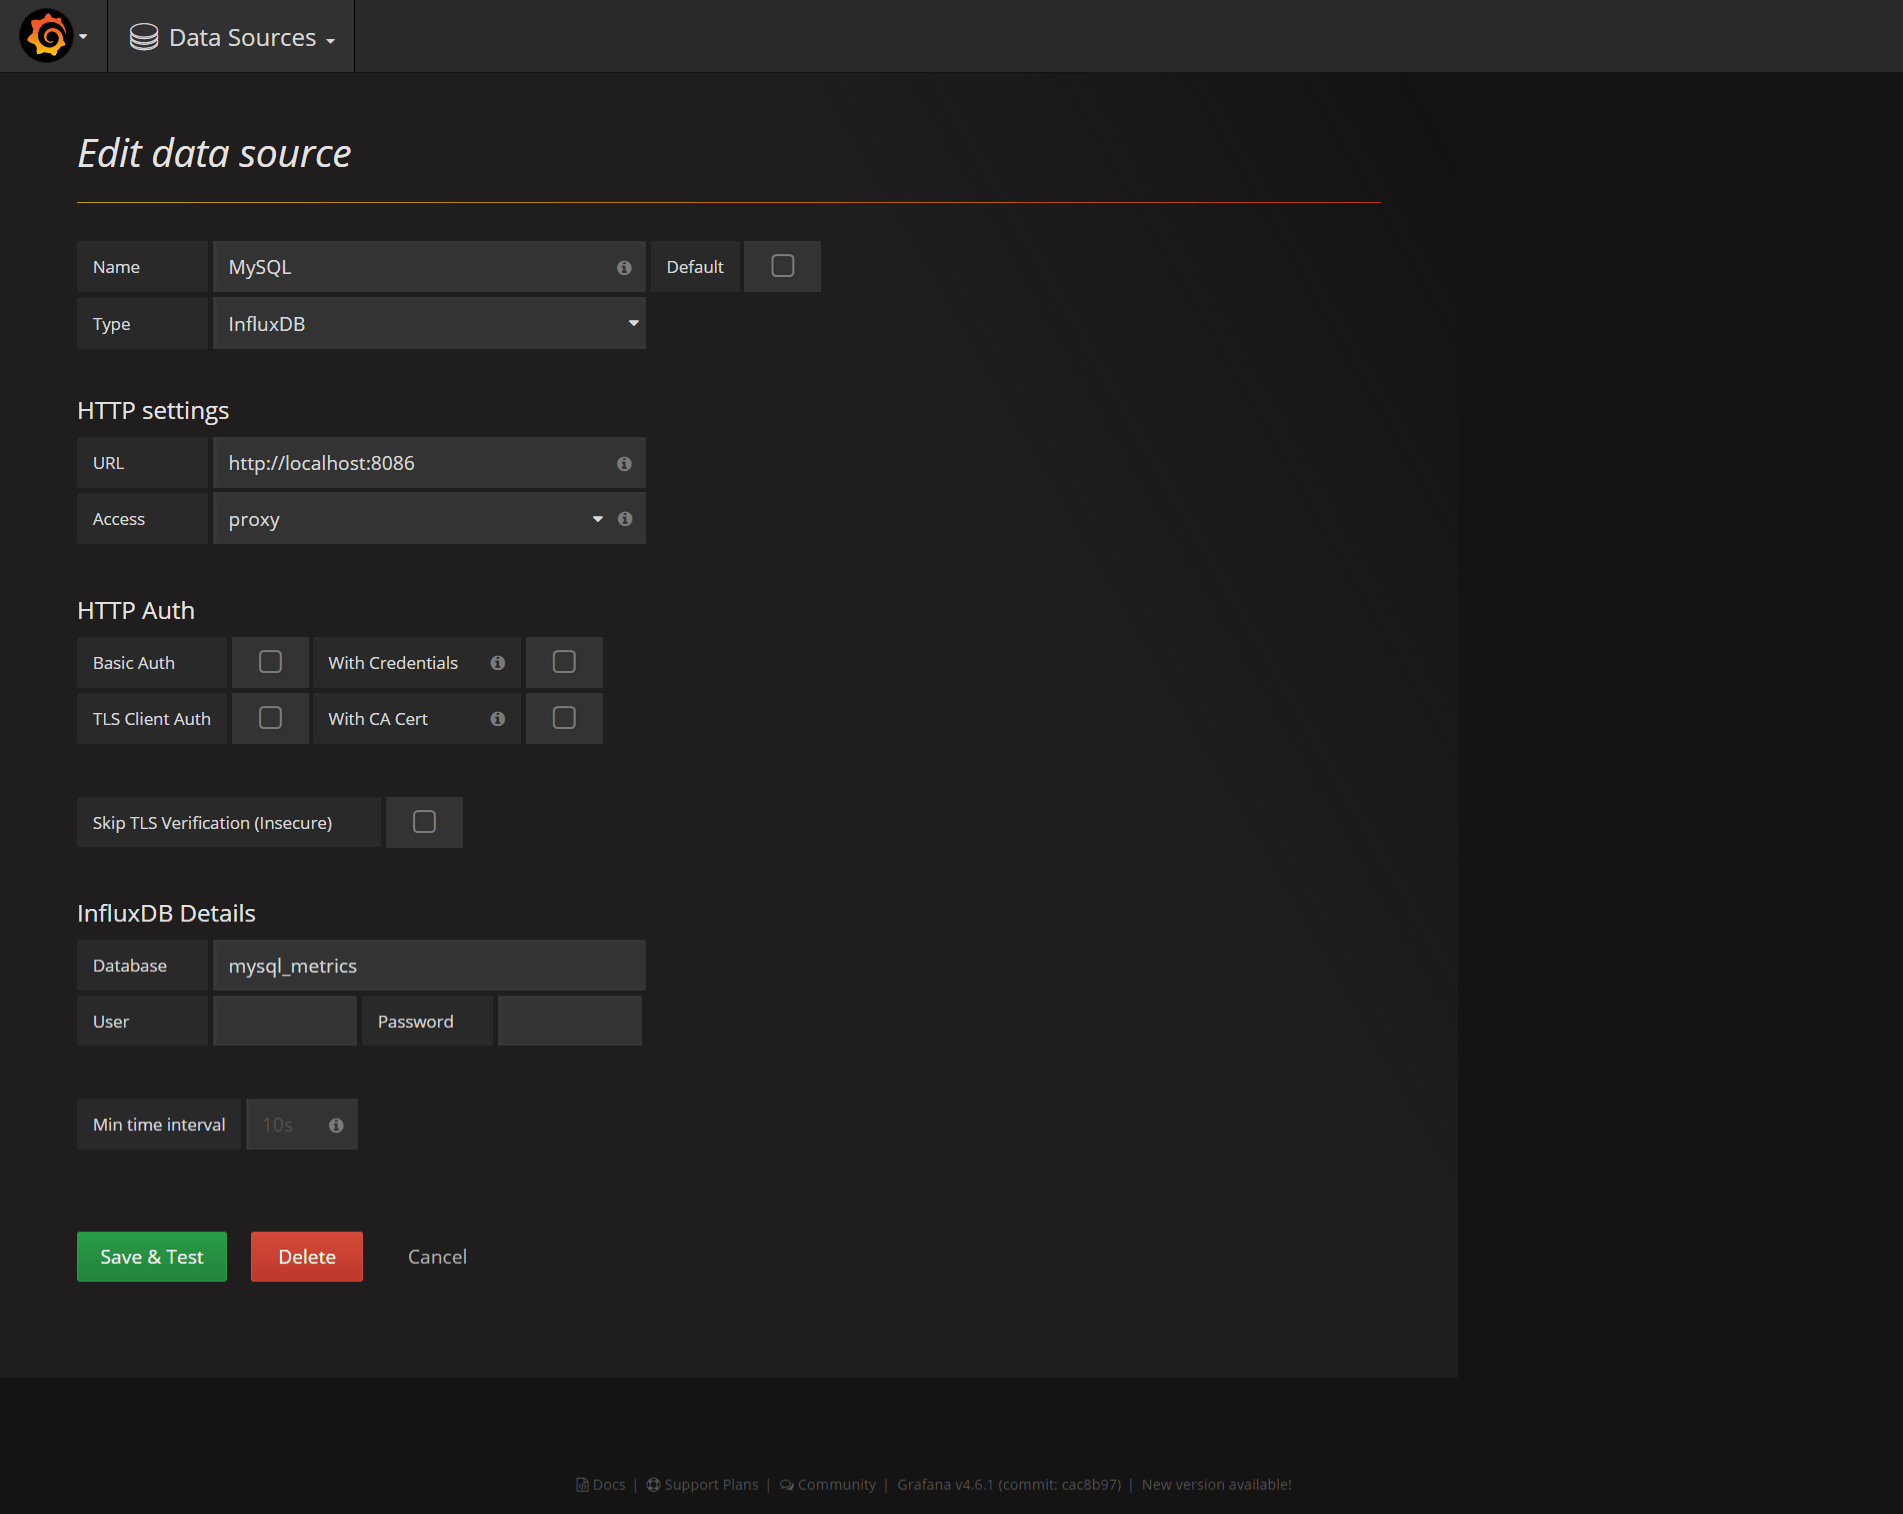
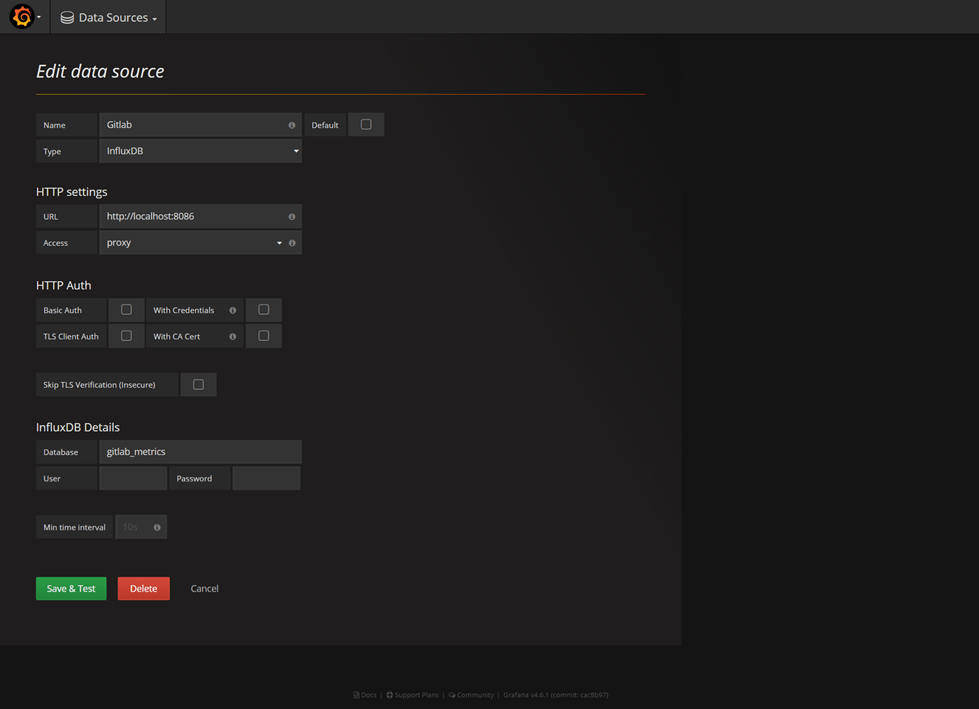
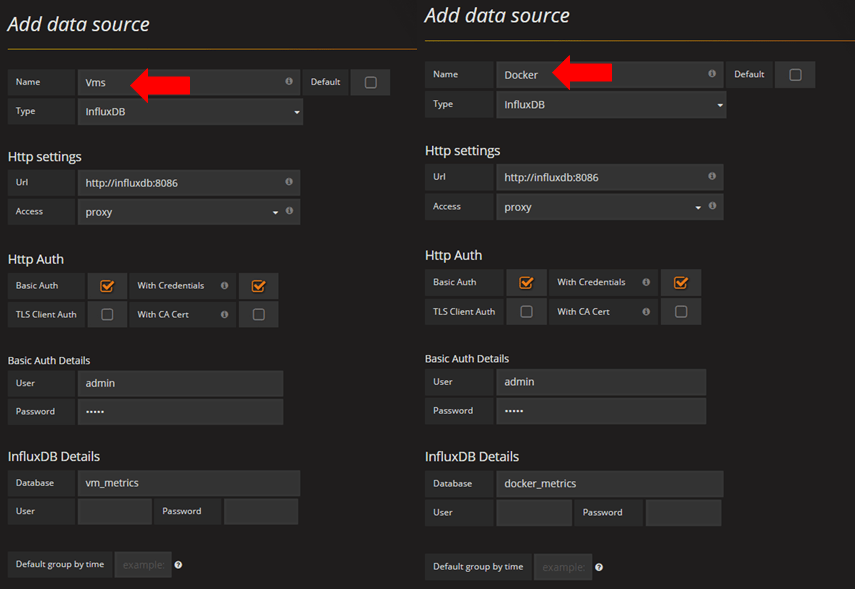
Grafana ships with built in support for CloudWatch, so add a new data source:


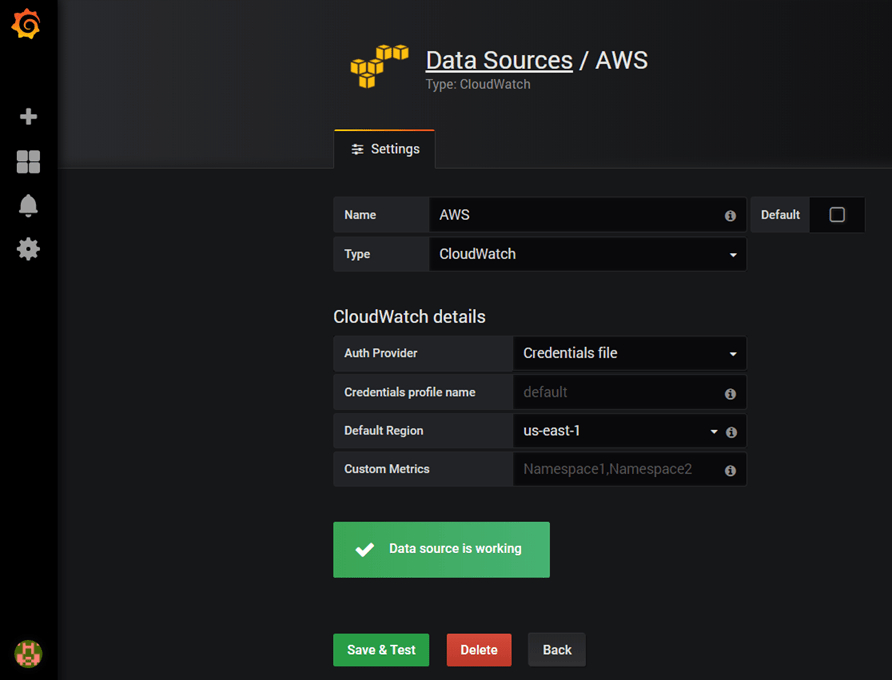
Note: In case you are using an IAM Role (recommended), keep the other fields empty as above, otherwise, create a new file at ~/.aws/credentials with your own AWS Access Key & Secret key.

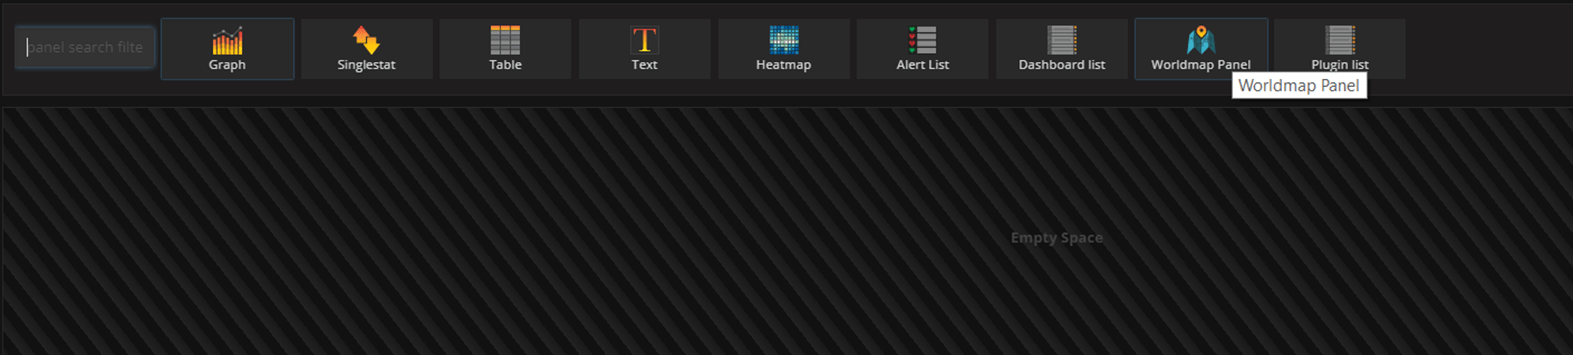
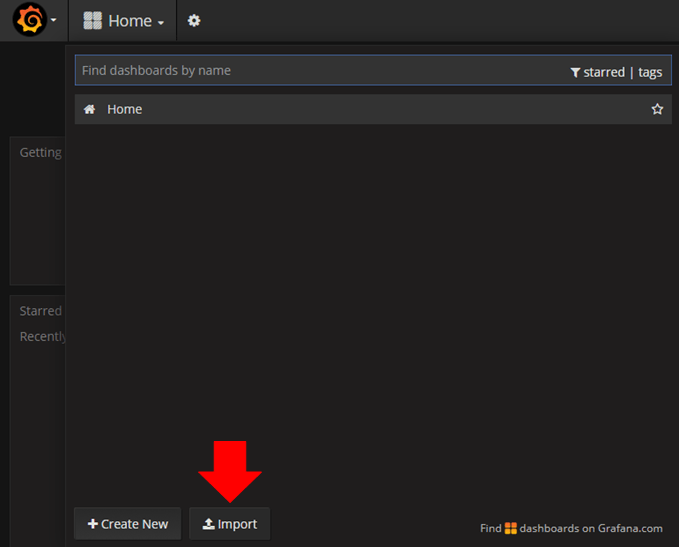
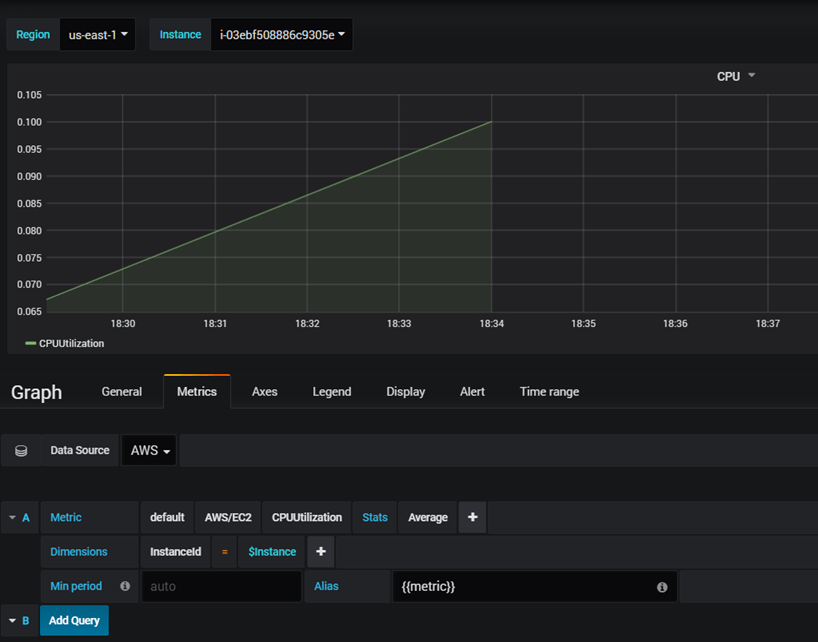
Create a new dashboard, and add new graph to the panel, select AWS/EC2 as namespace, CPUUtilization as metric, and the instance id of the instance you want to monitor in the dimension field:
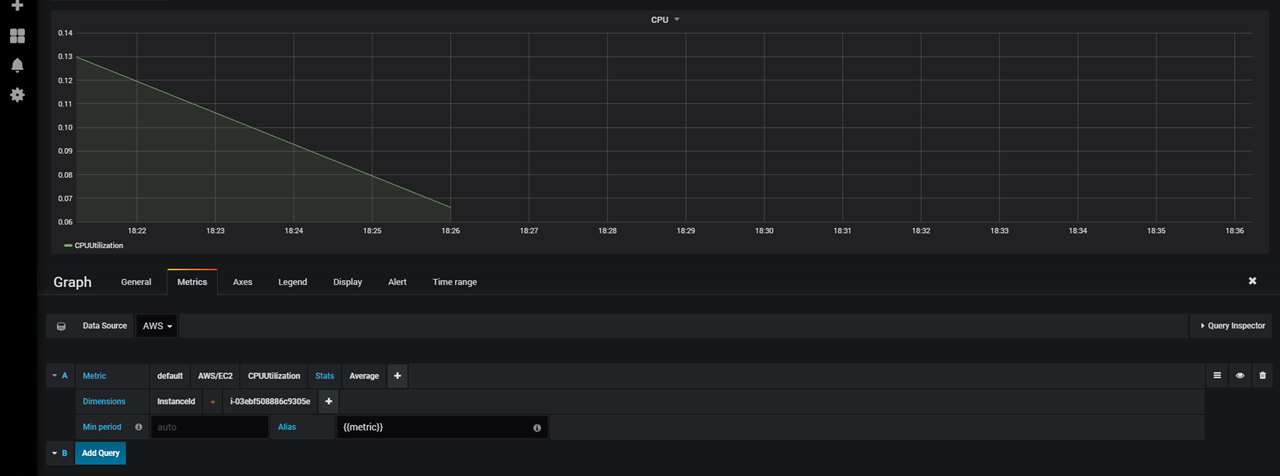


That’s great !


Well, instead of hard-coding the InstanceId in the query, we can use a feature in Grafana called “Query Variables“. Create a new variable to hold list of AWS supported regions :


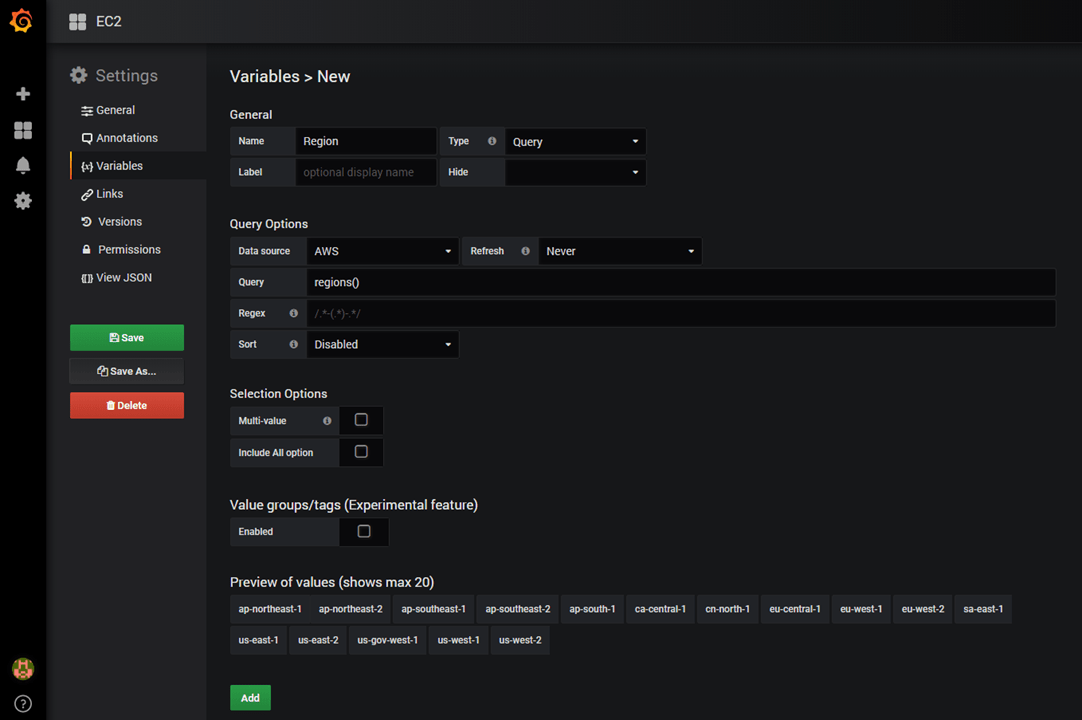
And, create a second variable to store list of instances ids per selected AWS region:


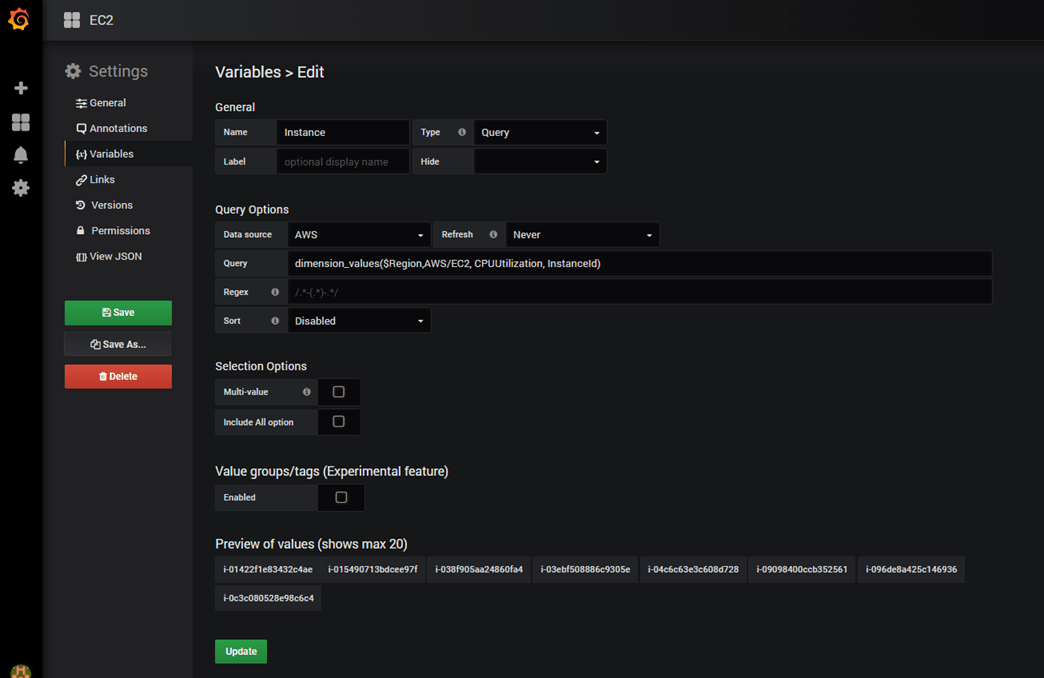
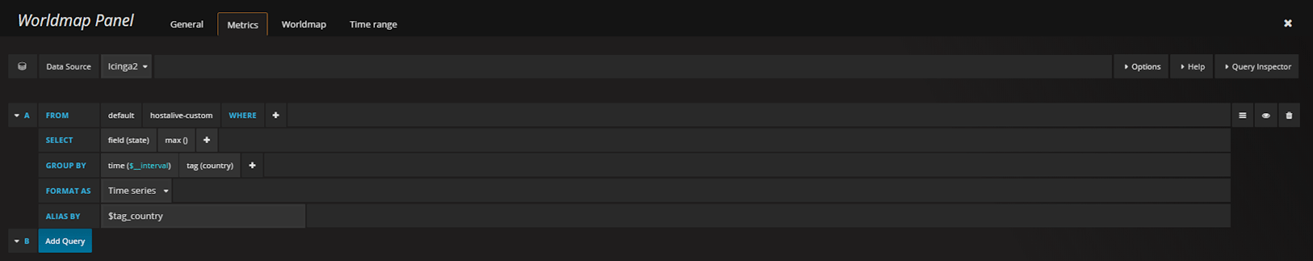
Now, go back to your graph and update the query as below:


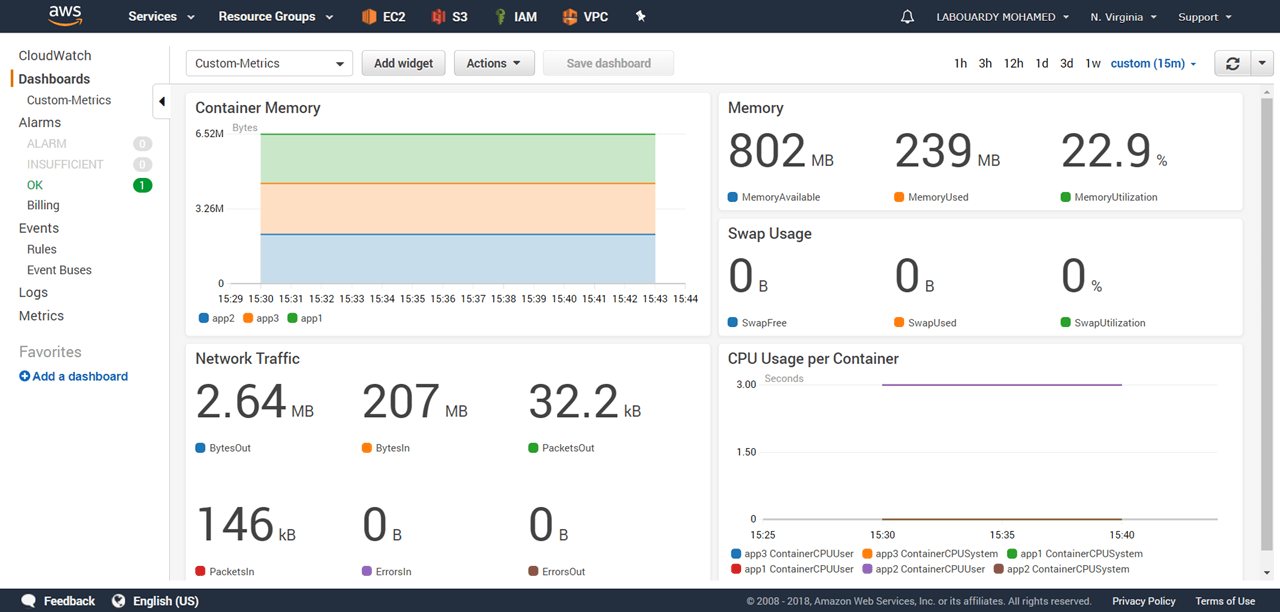
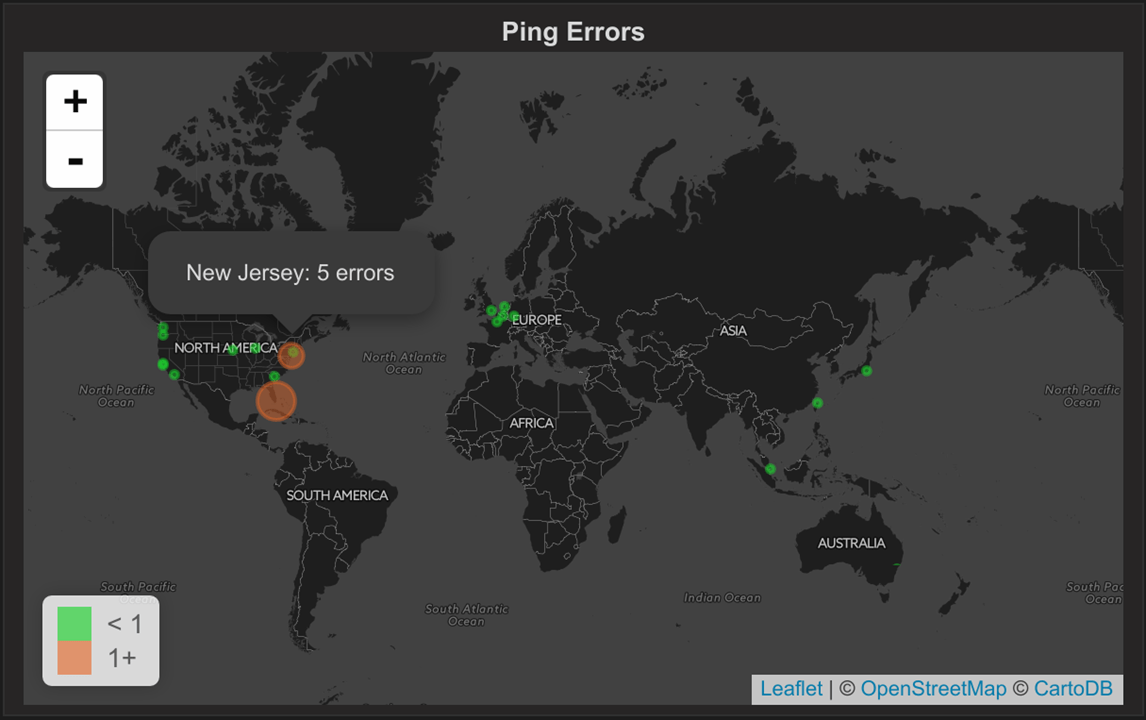
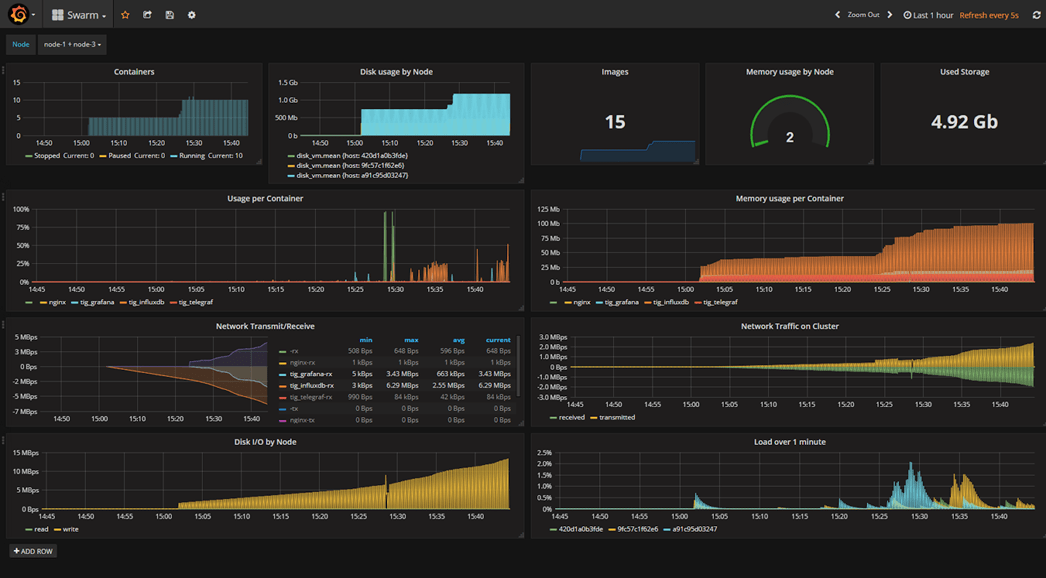
That’s it, go ahead and create other widgets:


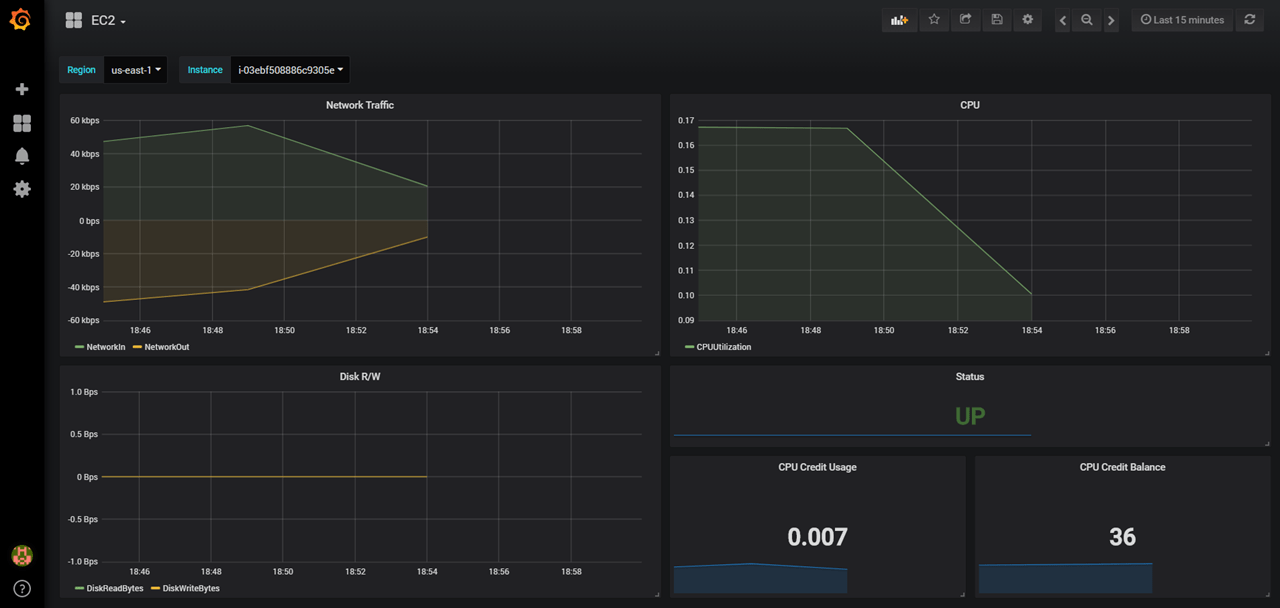
Note: You can download the dashboard from GitHub.

Now you’re ready to build interactive & dynamic dashboards for your CloudWatch metrics.

Drop your comments, feedback, or suggestions below — or connect with me directly on Twitter @mlabouardy.

Publish Custom Metrics to AWS CloudWatch

AWS Autoscaling Groups can only scale in response to metrics in CloudWatch and most of the default metrics are not sufficient for predictive scaling. That’s why you need to publish your custom metrics to CloudWatch.

I was surfing the internet as usual, and I couldn’t find any post talking about how to publish custom metrics to AWS CloudWatch, and because I’m a Gopher, I got my hand dirty and I wrote my own script in Go.

You can publish your own metrics to CloudWatch using the AWS Go SDK:

1
2
3
4
5
6
7
8
9
10
11
func Publish(metricData []cloudwatch.MetricDatum, namespace string) {
svc := cloudwatch.New(c.Config)
req := svc.PutMetricDataRequest(&cloudwatch.PutMetricDataInput{
MetricData: metricData,
Namespace: &namespace,
})
_, err := req.Send()
if err != nil {
log.Fatal(err)
}
}

To collect metrics about memory for example, you can either parse output of command ‘free -m’ or use a third-party library like gopsutil:

1
memoryMetrics, err := mem.VirtualMemory()

The memoryMetrics object expose multiple metrics:

  • Memory used
  • Memory available
  • Buffers
  • Swap cached
  • Page Tables
  • etc

Each metric will be published with an InstanceID dimension. To get the instance id, you can query the meta-data:

1
2
3
4
5
6
7
8
9
10
11
12
13
14
15
16
17
18
19
20
21
22
23
func GetInstanceID() (string, error) {
value := os.Getenv("AWS_INSTANCE_ID")
if len(value) > 0 {
return value, nil
}
client := &http.Client{}
req, err := http.NewRequest("GET", "http://169.254.169.254/latest/meta-data/instance-id", nil)
if err != nil {
return "", err
}

resp, err := client.Do(req)
if err != nil {
return "", err
}
defer resp.Body.Close()

data, err := ioutil.ReadAll(resp.Body)
if err != nil {
return "", err
}
return string(data), nil
}


What if I’m not a Gopher ? well, don’t freak out, I built a simple CLI which doesn’t require any Go knowledge or dependencies to be installed (AWS CloudWatch Monitoring Scripts requires Perl dependencies) and moreover it’s cross-platform.

The CLI collects the following metrics:

  • Memory: utilization, used, available.
  • Swap: utilization, used, free.
  • Disk: utilization, used, available.
  • Network: packets in/out, bytes in/out, errors in/out.
  • Docker: memory & cpu per container.

The CLI have been tested on instances using the following AMIs (64-bit versions):

  • Amazon Linux
  • Amazon Linux 2
  • Ubuntu 16.04
  • Microsoft Windows Server

To get started, find the appropriate package for your instance and download it. For linux:

1
2
wget https://s3.us-east-1.amazonaws.com/mon-put-instance-data/1.0.0/linux/mon-put-instance-data
chmod +x mon-put-instance-data

After you install the CLI, you may need to add the path to the executable file to your PATH variable. Then, issue the following command:

1
mon-put-instance-data --memory --swap --network --docker --interval 1

The command above will collect memory, swap, network & docker containers resource utilization on the current system.

Note: ensure an IAM role is associated with your instance, verify that it grants permission to perform cloudwatch:PutMetricData.


Now that we’ve written custom metrics to CloudWatch. You can view statistical graphs of your published metrics with the AWS Management Console:


You can create your own interactive and dynamic Dashboard based on these metrics:


Hope it helps ! The CLI is still in its early stages, so you are welcome to contribute to the project on GitHub.

Drop your comments, feedback, or suggestions below — or connect with me directly on Twitter @mlabouardy.

Network Infrastructure Weathermap

The main goal of collecting metrics is to store them for long term usage and to create graphs to debug problems or identify trends. However, storing metrics about your system isn’t enough to identity the problem’s & anomalies root cause. It’s necessary to have a high-level overview of your network backbone. Weathermap is perfect for a Network Operations Center (NOC). In this post, I will show you how to build one using Open Source tools only.


Icinga 2 will collect metrics about your backbone, write checks results metrics and performance data to InfluxDB (supported since Icinga 2.5). Visualize these metrics in Grafana in map form.

To get started, add your desired host configuration inside the hosts.conf file:

1
2
3
4
5
6
7
8
9
10
11
12
13
14
15
object Host "server1" {
import "generic-host"
address = "13.228.28.25"
vars.os = "cisco"
vars.city = "Paris"
vars.country = "FR"
}

object Host "server2" {
import "generic-host"
address = "13.228.28.26"
vars.os = "junos"
vars.city = "London"
vars.country = "GB"
}

Note: the city & country attributes will be used to create the weathermap.

To enable the InfluxDBWriter on your Icinga 2 installation, type the following command:

1
icinga2 feature enable influxdb

Configure your InfluxDB host and database in /etc/icinga2/features-enabled/influxdb.conf (Learn more about the InfluxDB configuration)

1
2
3
4
5
6
7
8
9
10
11
12
13
14
15
16
17
18
19
20
21
22
23
24
25
26
27
28
library "perfdata"

object InfluxdbWriter "influxdb" {
host = "localhost"
port = 8086
database = "icinga2_metrics"

flush_threshold = 1024
flush_interval = 10s
enable_send_metadata = true
enable_send_thresholds = true

host_template = {
measurement = "$host.check_command$"
tags = {
hostname = "$host.name$"
city = "$city$"
country = "$country$"
}
}
service_template = {
measurement = "$service.check_command$"
tags = {
hostname = "$host.name$"
service = "$service.name$"
}
}
}

Icinga 2 will forward all your metrics to a icinga2_metrics database. The included host and service templates define a storage, the measurement represents a table by which metrics are grouped with tags certain measurements of certain hosts or services are defined (notice the city & country tags usage).

Don’t forget to restart Icinga 2 after saving your changes:

1
service icinga2 restart

Once Icinga 2 is up and running it’ll start collecting data and writing them to InfluxDB:


Once our data arrived, it’s time for visualization. Grafana is widely used to generate graphs and dashboards. To create a Weathermap we can use a Grafana plugin called Worldmap Panel. Make sure to install it using grafana-cli tool:

1
grafana-cli plugins install grafana-worldmap-panel

The plugin will be installed into your grafana plugins directory (/var/lib/grafana/plugins):

Restart Grafana, navigate to Grafana web interface and create a new datasource:


Create a new Dashboard:


The Group By clause should be the country code and an alias is needed too. The alias should be in the form $tag_field_name. See the image below for an example of a query:


Under the Worldmap tab, choose the countries option:


Finally, you should see a tile map of the world with circles representing the state of each host.


The field state possible values (0 – OK, 1 – Warning, 2 – Critical, 3 – Unknown/Unreachable)

Note: For lazy people I created a ready to use Dashboard you can import from GitHub.

Drop your comments, feedback, or suggestions below — or connect with me directly on Twitter @mlabouardy.

MySQL Monitoring with Telegraf, InfluxDB & Grafana

This post will walk you through each step of creating interactive, real-time & dynamic dashboard to monitor your MySQL instances using Telegraf, InfluxDB & Grafana.

Start by enabling the MySQL input plugin in /etc/telegraf/telegraf.conf :

1
2
3
4
5
6
7
8
[[inputs.mysql]]
servers = ["root:root@tcp(localhost:3306)/?tls=false"]
name_suffix = "_mysql"

[[outputs.influxdb]]
database = "mysql_metrics"
urls = ["http://localhost:8086"]
namepass = ["*_mysql"]

Once Telegraf is up and running it’ll start collecting data and writing them to the InfluxDB database:


Finally, point your browser to your Grafana URL, then login as the admin user. Choose ‘Data Sources‘ from the menu. Then, click ‘Add new‘ in the top bar.

Fill in the configuration details for the InfluxDB data source:


You can now import the dashboard.json file by opening the dashboard dropdown menu and click ‘Import‘ :


Note: Check my GitHub for more interactive & beautiful Grafana dashboards.

Drop your comments, feedback, or suggestions below — or connect with me directly on Twitter @mlabouardy.

GitLab Performance Monitoring with Grafana

Since GitLab v8.4 you can monitor your own instance with InfluxDB & Grafana stack by using the GitLab application performance measuring system called “Gitlab Performance Monitoring“.

GitLab writes metrics to InfluxDB via UDP. Therefore, this must be enabled in /etc/influxdb/influxdb.conf:

1
2
3
4
5
6
7
8
9
10
11
12
13
14
15
16
17
18
19
[meta]
dir = "/var/lib/influxdb/meta"

[data]
dir = "/var/lib/influxdb/data"
engine = "tsm1"
wal-dir = "/var/lib/influxdb/wal"

[admin]
enabled = true

[[udp]]
enabled = true
bind-address = ":8089"
database = "gitlab_metrics"
batch-size = 1000
batch-pending = 5
batch-timeout = "1s"
read-buffer = 209715200

Restart your InfluxDB instance. Then, create a database to store GitLab metrics:

1
CREATE DATABASE "gitlab_metrics"

Next, go to Gitlab Setings Dashboard and enable InfluxDB Metrics as shown below:


Then, you need to restart GitLab:

1
gitlab-ctl restart

Now your GitLab instance should send data to InfluxDB:


Finally, Point your browser to your Grafana URL, then login as the admin user. Choose ‘Data Sources‘ from the menu. Then, click ‘Add new‘ in the top bar.

Fill in the configuration details for the InfluxDB data source:


You can now import the dashboard.json file by opening the dashboard dropdown menu and click ‘Import‘ :


Note: Check my GitHub for more interactive & beautiful Grafana dashboards.

Drop your comments, feedback, or suggestions below — or connect with me directly on Twitter @mlabouardy.

Exploring Swarm & Container Overview Dashboard in Grafana

In my previous post, your learnt how to monitor your Swarm Cluster with TICK Stack. In this part, I will show you how to use the same Stack but instead of using Chronograf as our visualization and exploration tool we will use Grafana.

Connect to your manager node via SSH, and clone the following GitHub repository:

1
git clone https://github.com/mlabouardy/swarm-tig.git

Use the docker-compose.yml below to setup the monitoring stack:

1
2
3
4
5
6
7
8
9
10
11
12
13
14
15
16
17
18
19
20
21
22
23
24
25
26
27
28
29
30
31
32
33
34
35
36
37
38
39
40
41
42
43
44
45
46
47
48
49
version: "3.3"

services:
telegraf:
image: telegraf:1.3
networks:
- tig-net
volumes:
- /var/run/docker.sock:/var/run/docker.sock
configs:
- source: telegraf-config
target: /etc/telegraf/telegraf.conf
deploy:
restart_policy:
condition: on-failure
mode: global

influxdb:
image: influxdb:1.2
networks:
- tig-net
deploy:
restart_policy:
condition: on-failure
placement:
constraints:
- node.role == worker

grafana:
container_name: grafana
image: grafana/grafana:4.3.2
ports:
- "3000:3000"
networks:
- tig-net
deploy:
restart_policy:
condition: on-failure
placement:
constraints:
- node.role == manager

configs:
telegraf-config:
file: $PWD/conf/telegraf/telegraf.conf

networks:
tig-net:
driver: overlay

Then, issue the following command to deploy the stack:

1
docker stack deploy --compose-file docker-compose.yml tig

Once deployed, you should see the list of services running on the cluster:


Point your browser to http://IP:3000, you should be able to reach the Grafana Dashboard:


The default username & password are admin. Go ahead and log in.

Go to “Data Sources” and create 2 InfluxDB data sources:

  • Vms: pointing to your Cluster Nodes metrics database.
  • Docker: pointing to your Docker Services metrics database.


Finally, import the dashboard by hitting the “import” button:


From here, you can upload the dashboard.json, then pick the data sources you created earlier:


You will end up with an interactive and dynamic dashboard:


Drop your comments, feedback, or suggestions below — or connect with me directly on Twitter @mlabouardy.

Your browser is out-of-date!

Update your browser to view this website correctly. Update my browser now

×