


This post will walk you through each step of creating interactive, real-time & dynamic dashboard to monitor your MySQL instances using Telegraf, InfluxDB & Grafana.
Start by enabling the MySQL input plugin in /etc/telegraf/telegraf.conf :
1 | [[inputs.mysql]] |
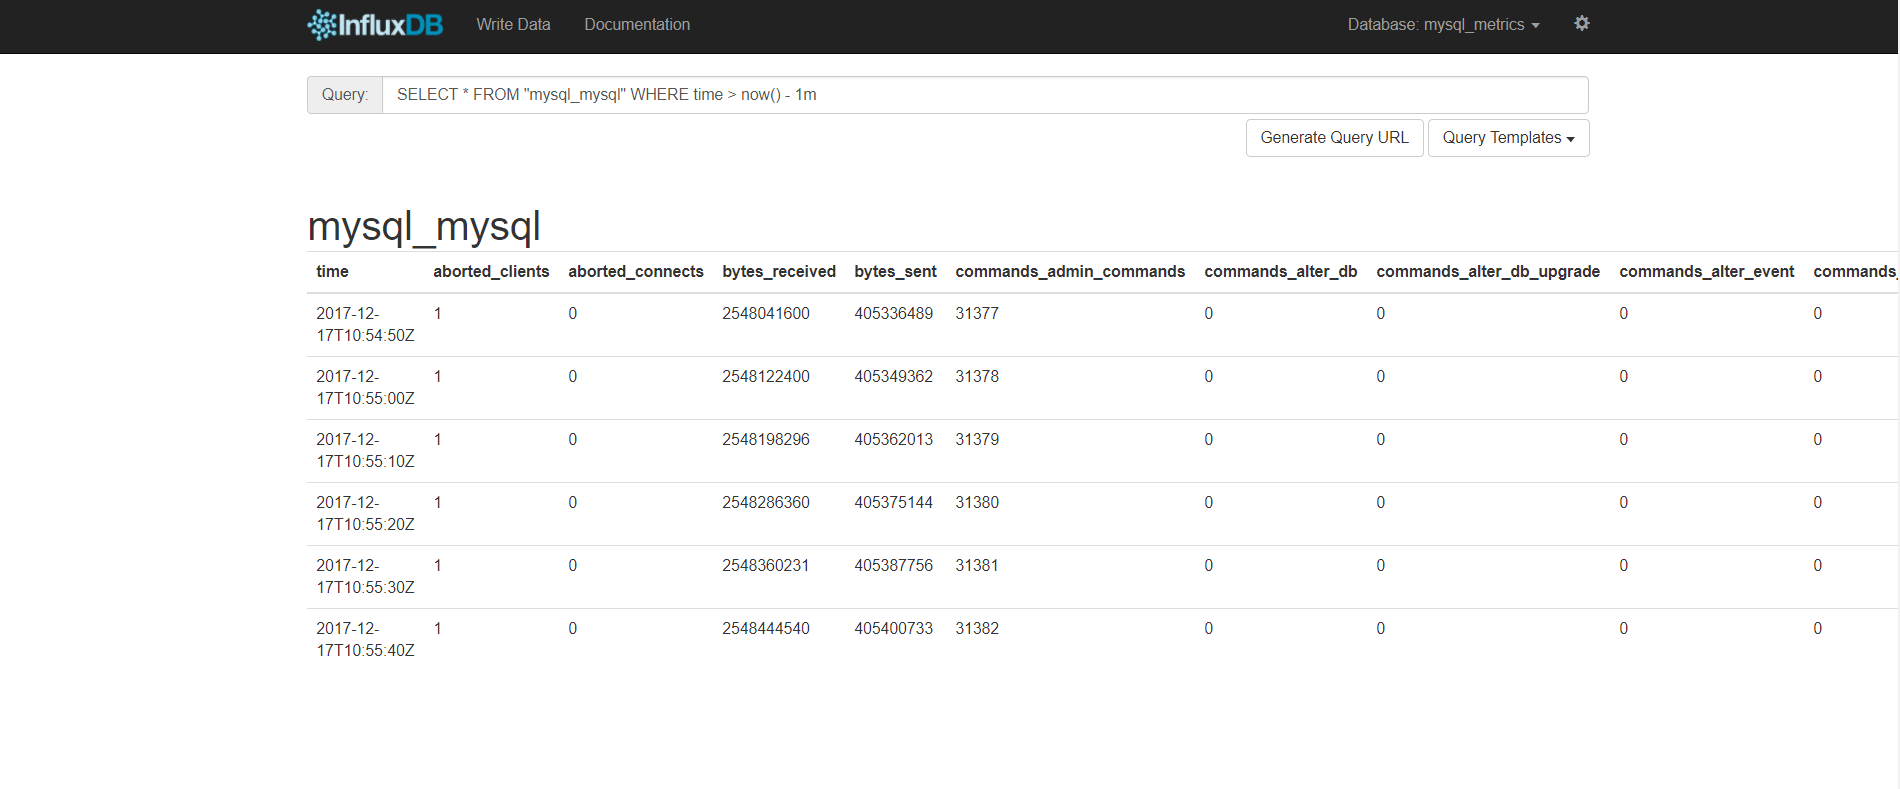
Once Telegraf is up and running it’ll start collecting data and writing them to the InfluxDB database:
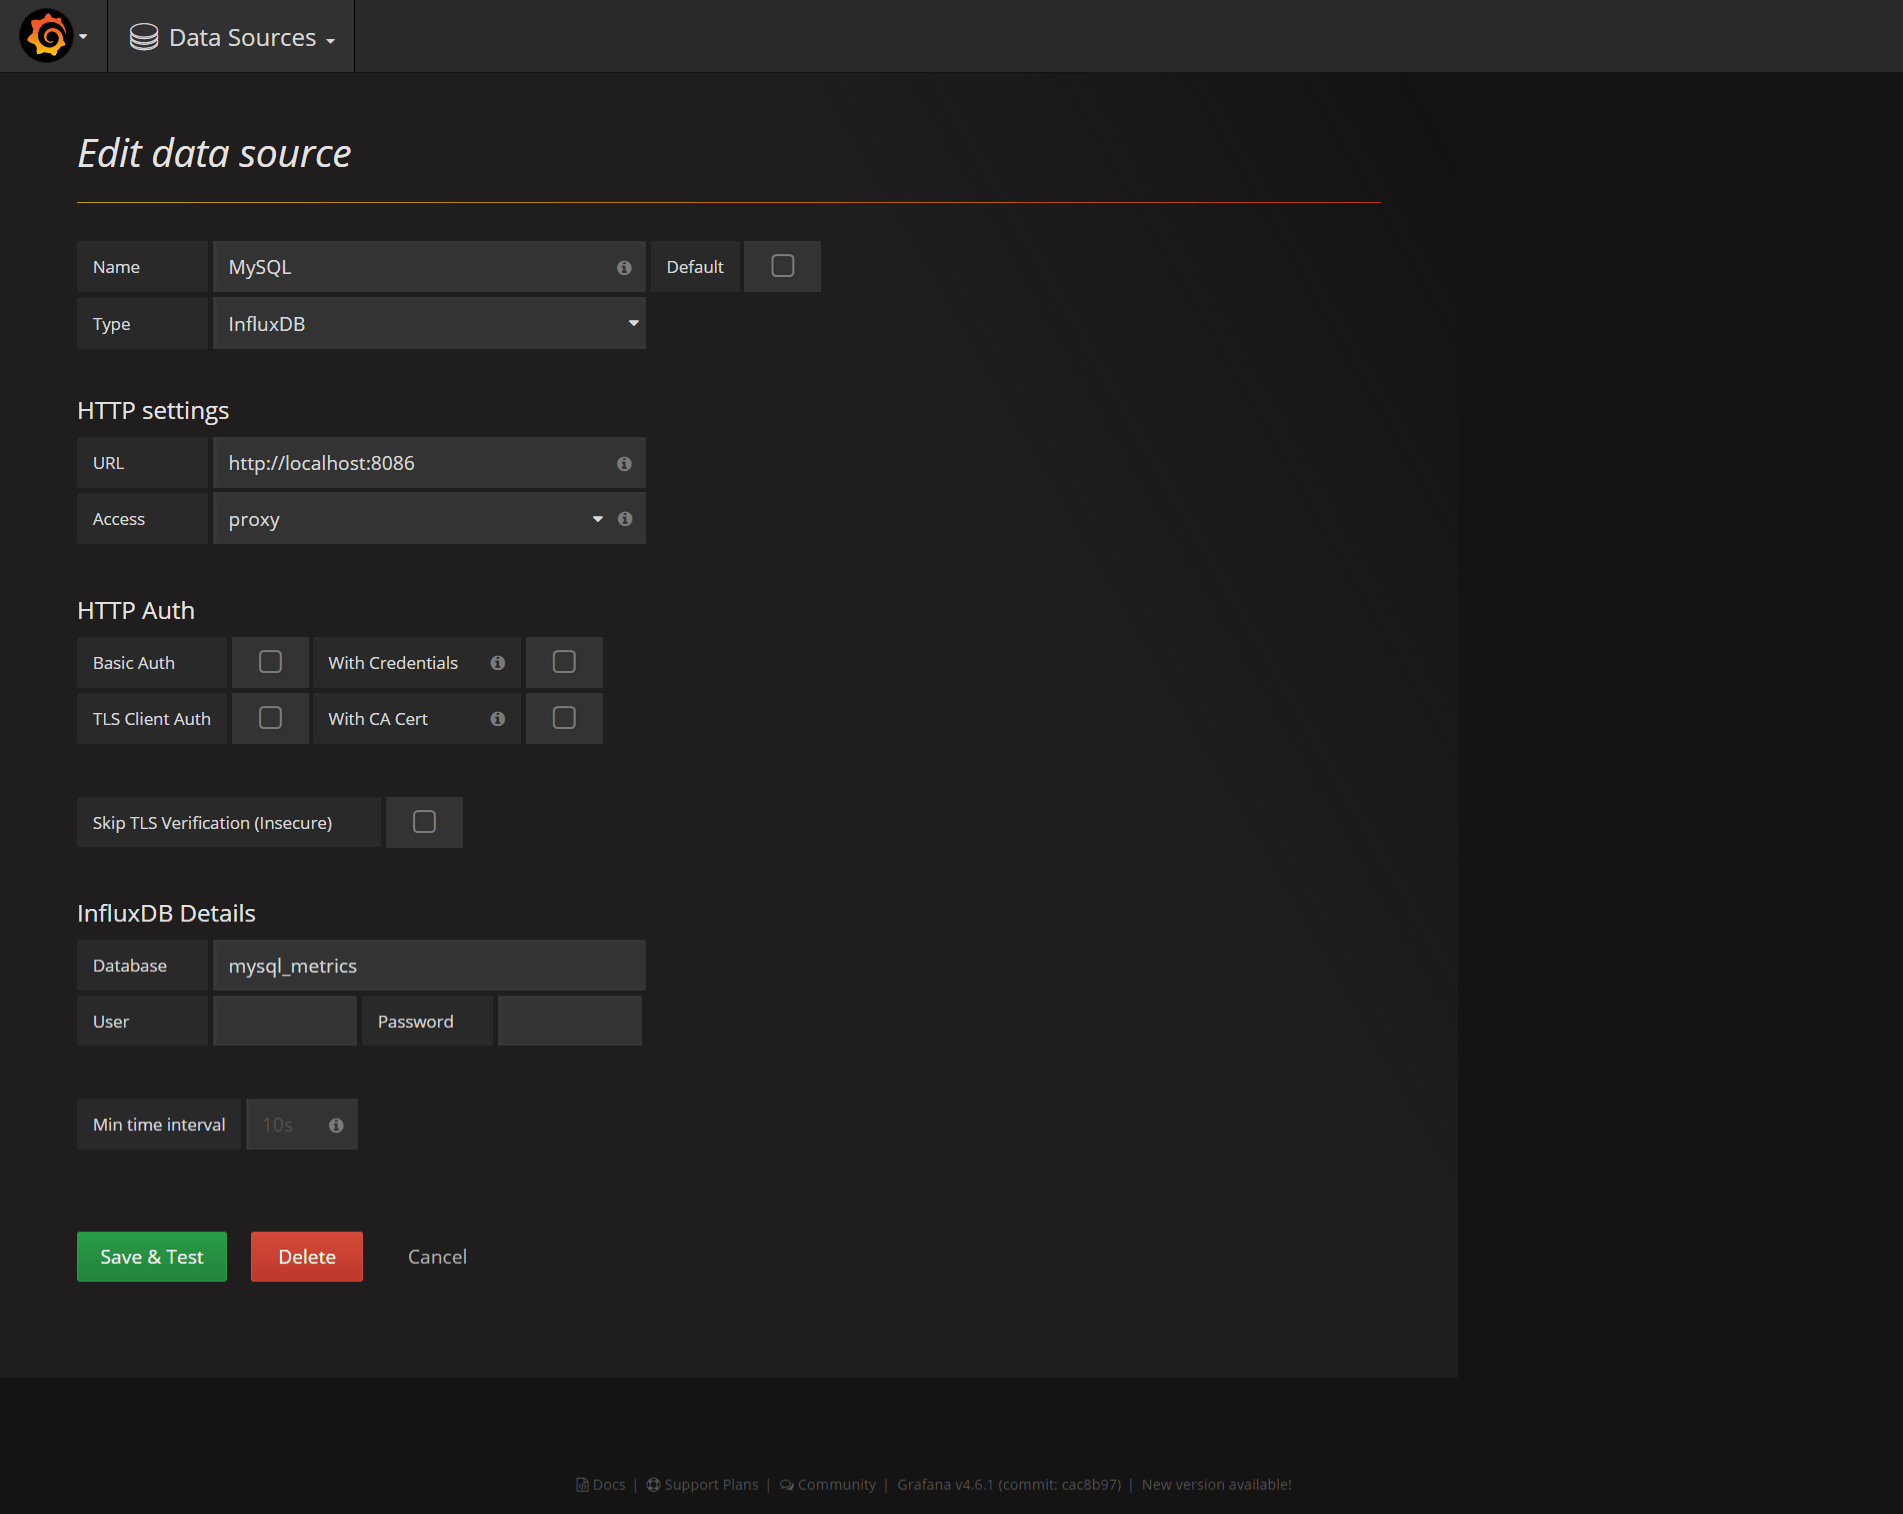
Finally, point your browser to your Grafana URL, then login as the admin user. Choose ‘Data Sources‘ from the menu. Then, click ‘Add new‘ in the top bar.
Fill in the configuration details for the InfluxDB data source:
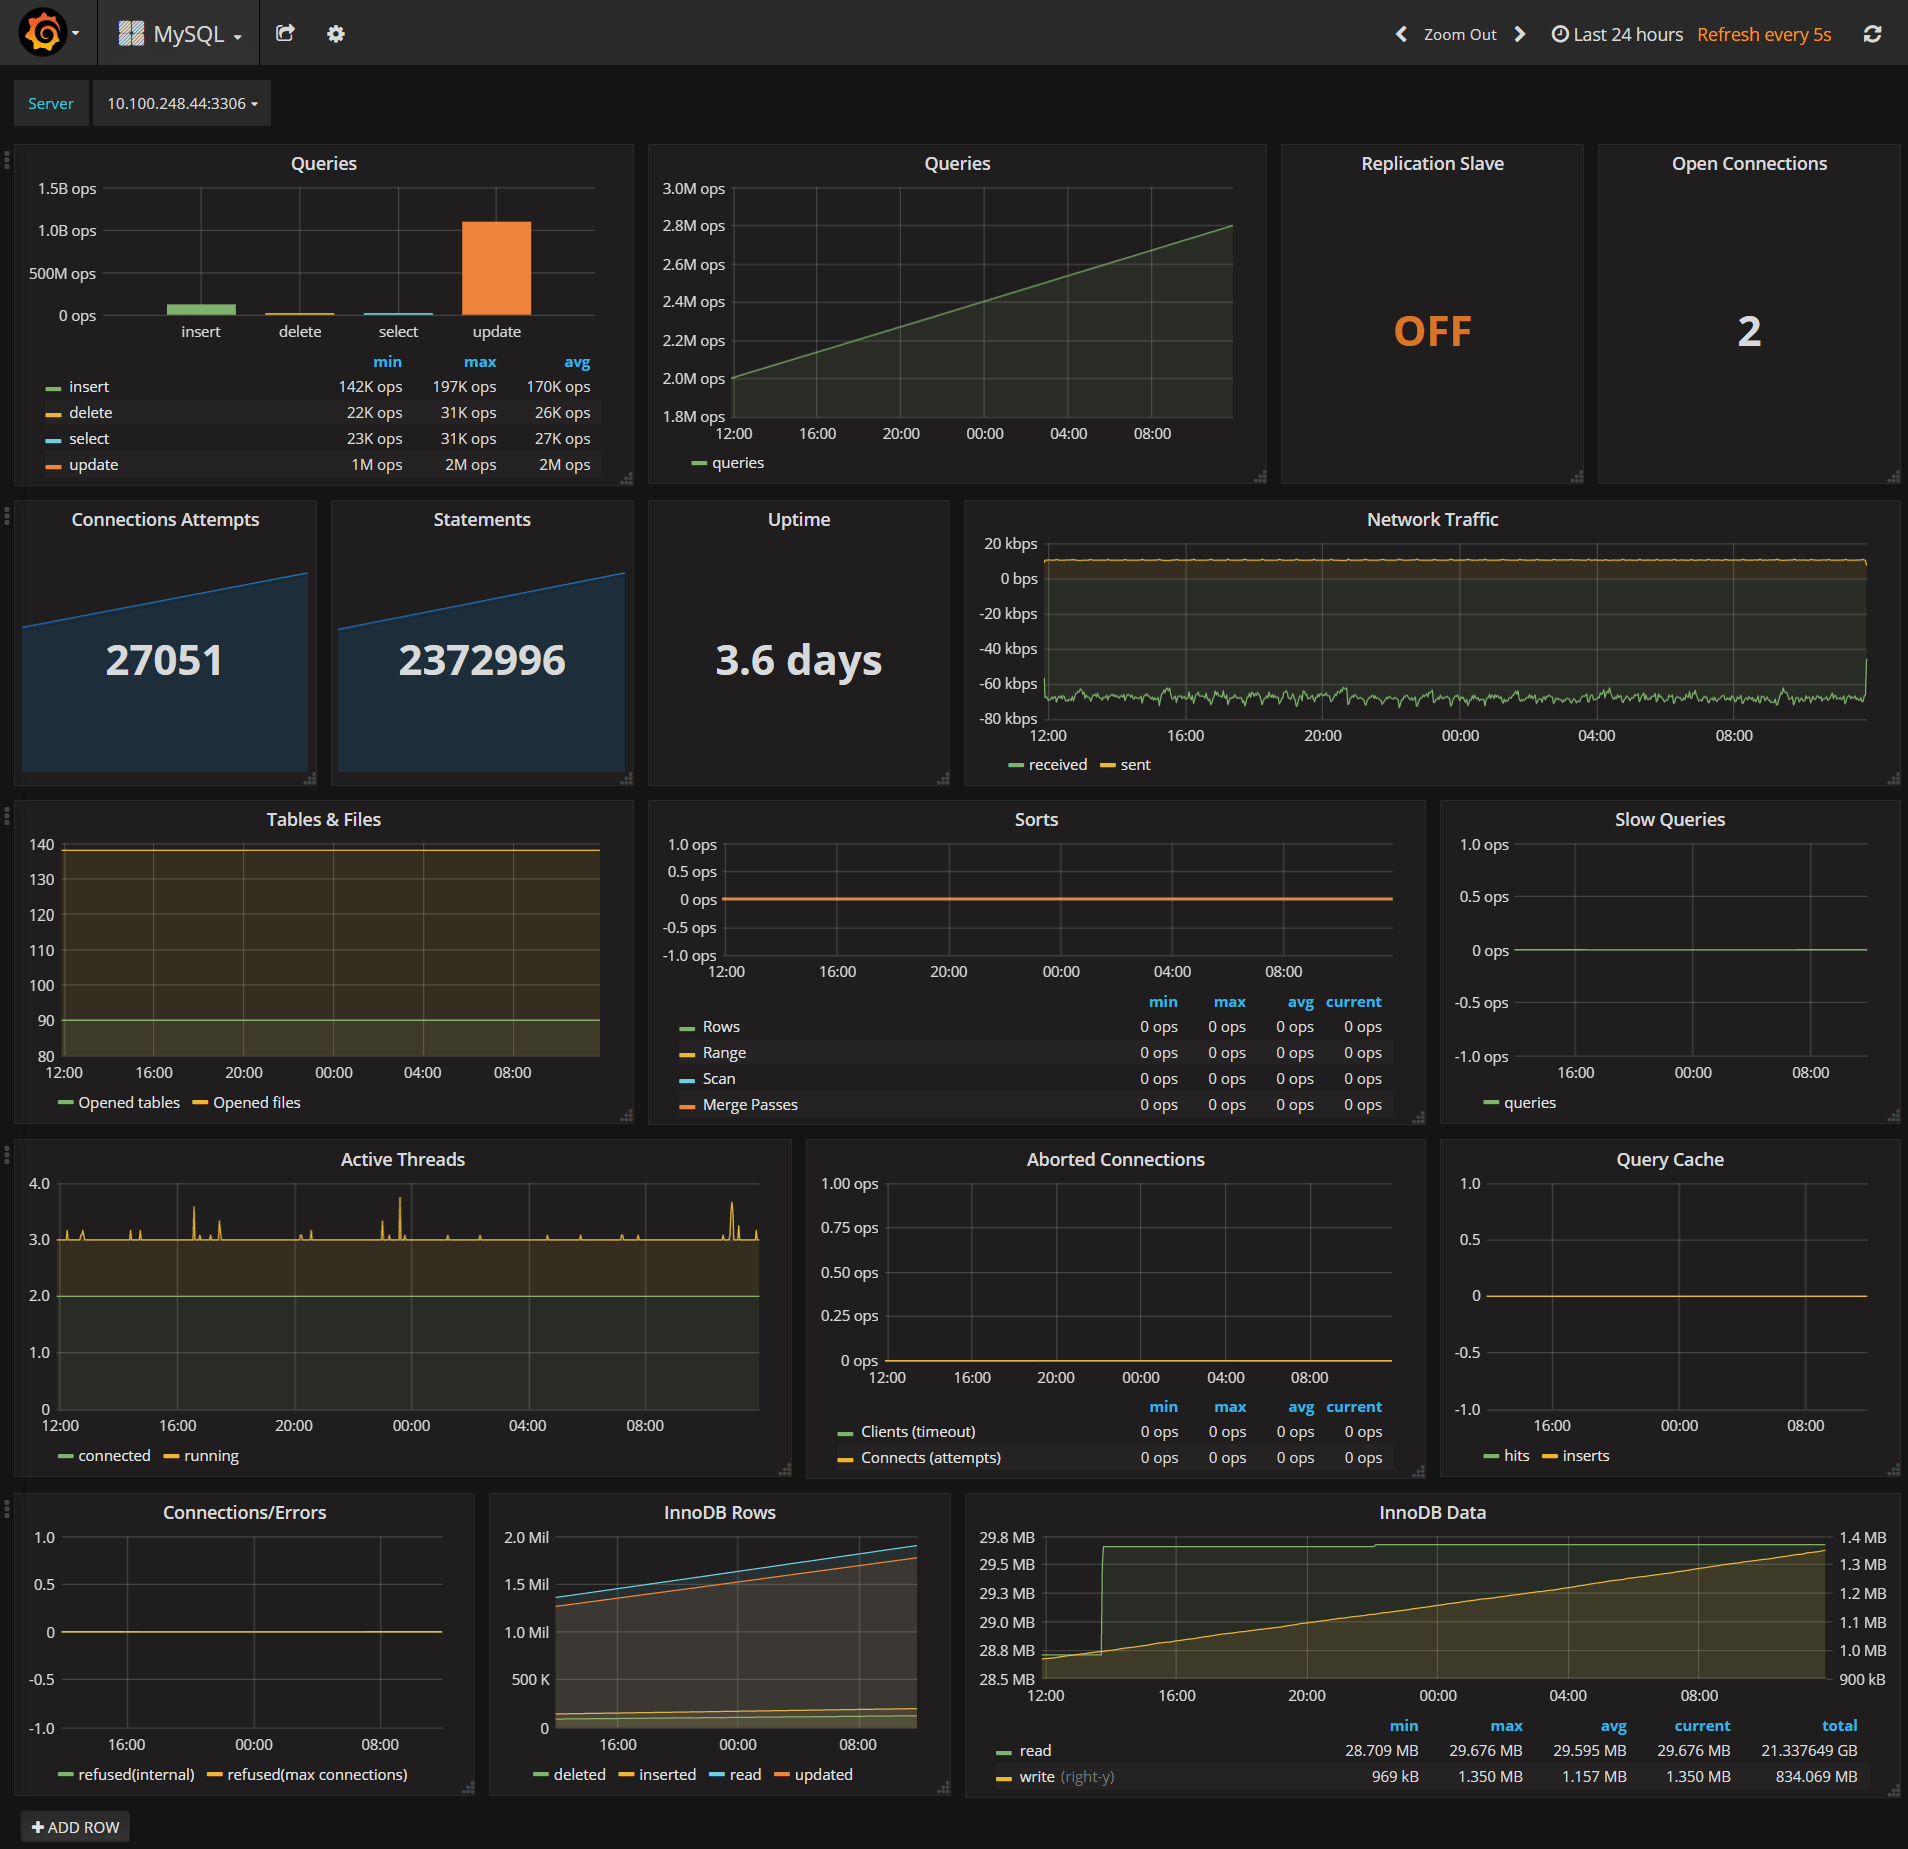
You can now import the dashboard.json file by opening the dashboard dropdown menu and click ‘Import‘ :
Note: Check my GitHub for more interactive & beautiful Grafana dashboards.
Drop your comments, feedback, or suggestions below — or connect with me directly on Twitter @mlabouardy.