


Since GitLab v8.4 you can monitor your own instance with InfluxDB & Grafana stack by using the GitLab application performance measuring system called “Gitlab Performance Monitoring“.
GitLab writes metrics to InfluxDB via UDP. Therefore, this must be enabled in /etc/influxdb/influxdb.conf:
1 | [meta] |
Restart your InfluxDB instance. Then, create a database to store GitLab metrics:
1 | CREATE DATABASE "gitlab_metrics" |
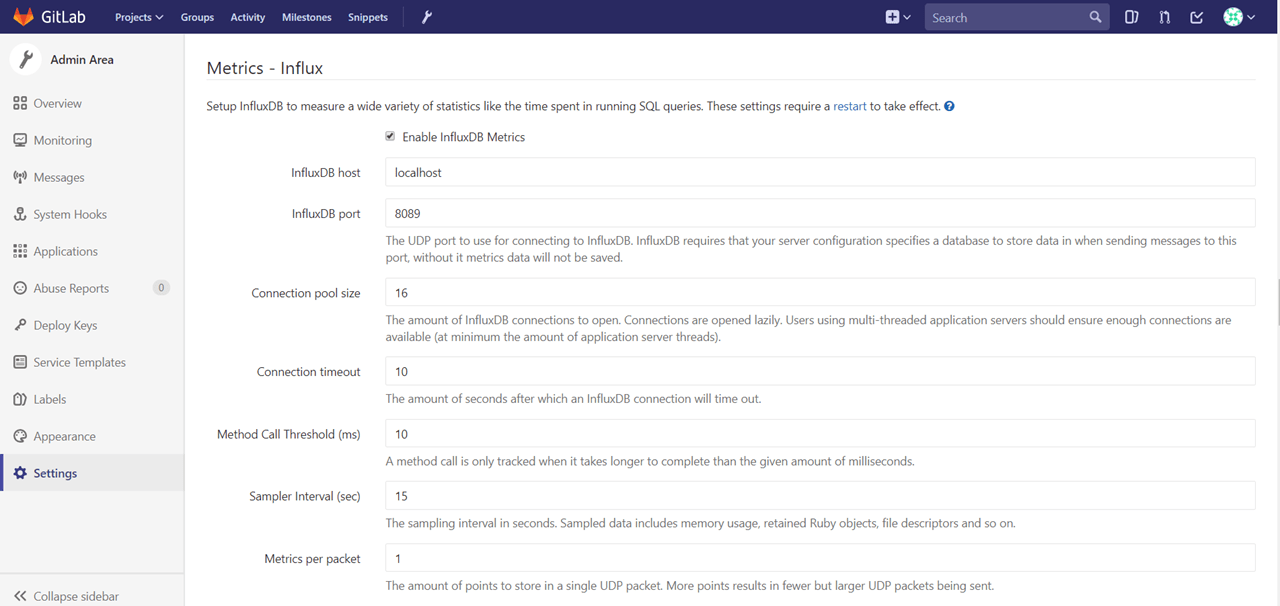
Next, go to Gitlab Setings Dashboard and enable InfluxDB Metrics as shown below:
Then, you need to restart GitLab:
1 | gitlab-ctl restart |
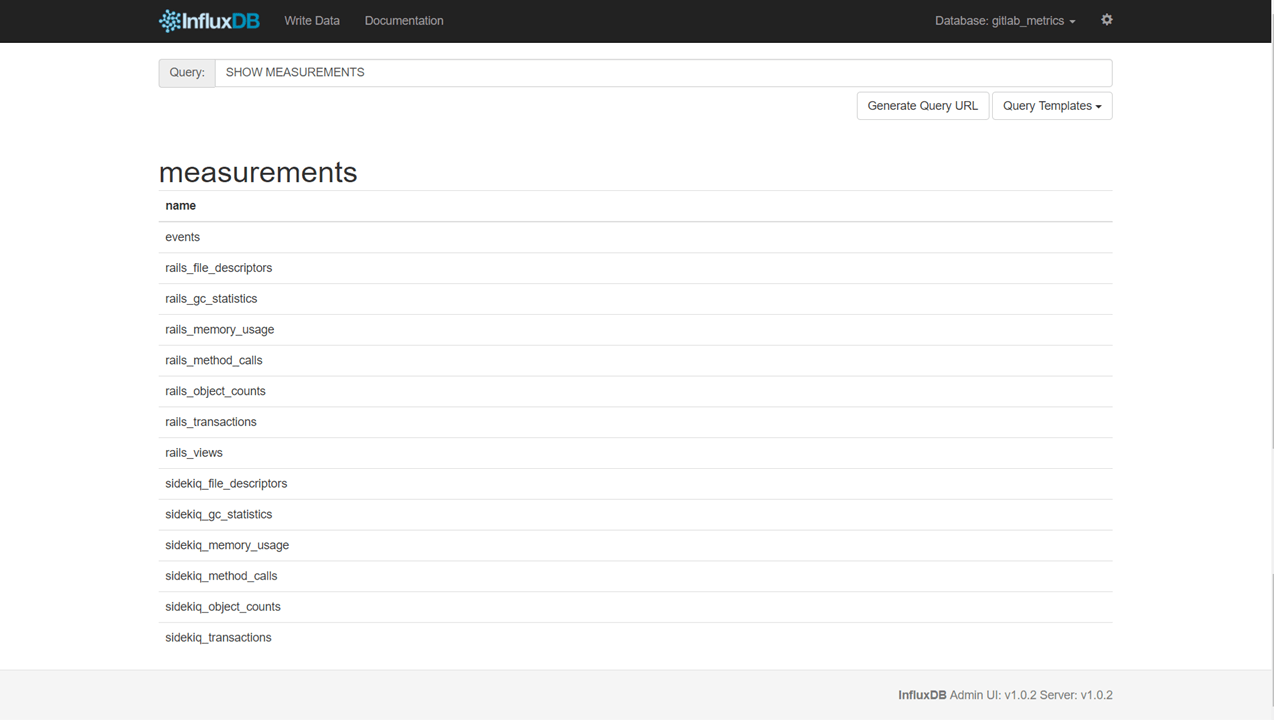
Now your GitLab instance should send data to InfluxDB:
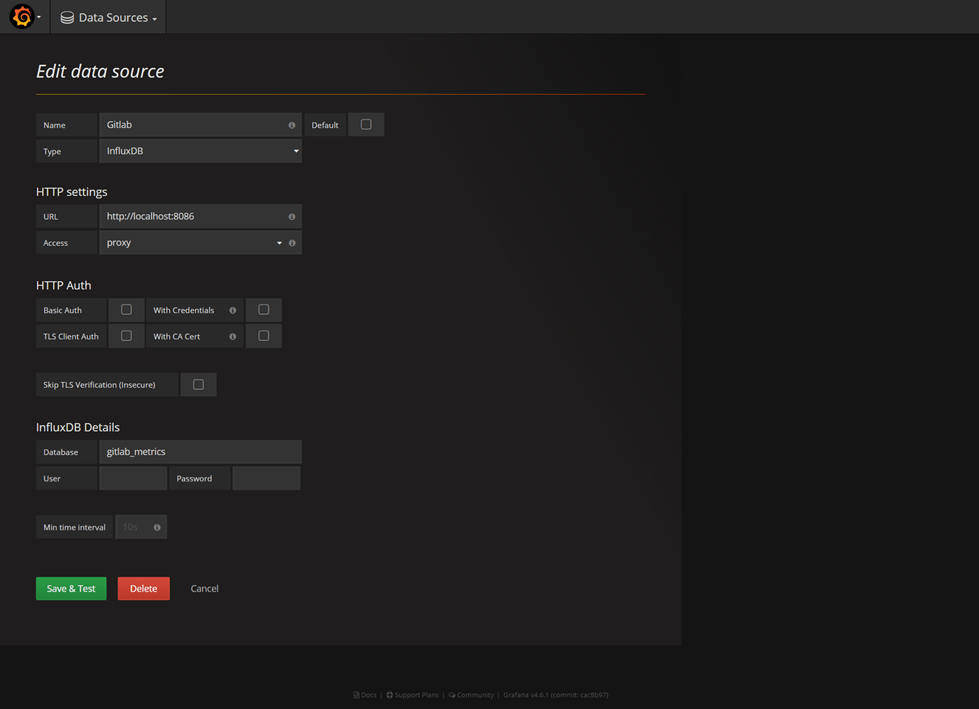
Finally, Point your browser to your Grafana URL, then login as the admin user. Choose ‘Data Sources‘ from the menu. Then, click ‘Add new‘ in the top bar.
Fill in the configuration details for the InfluxDB data source:
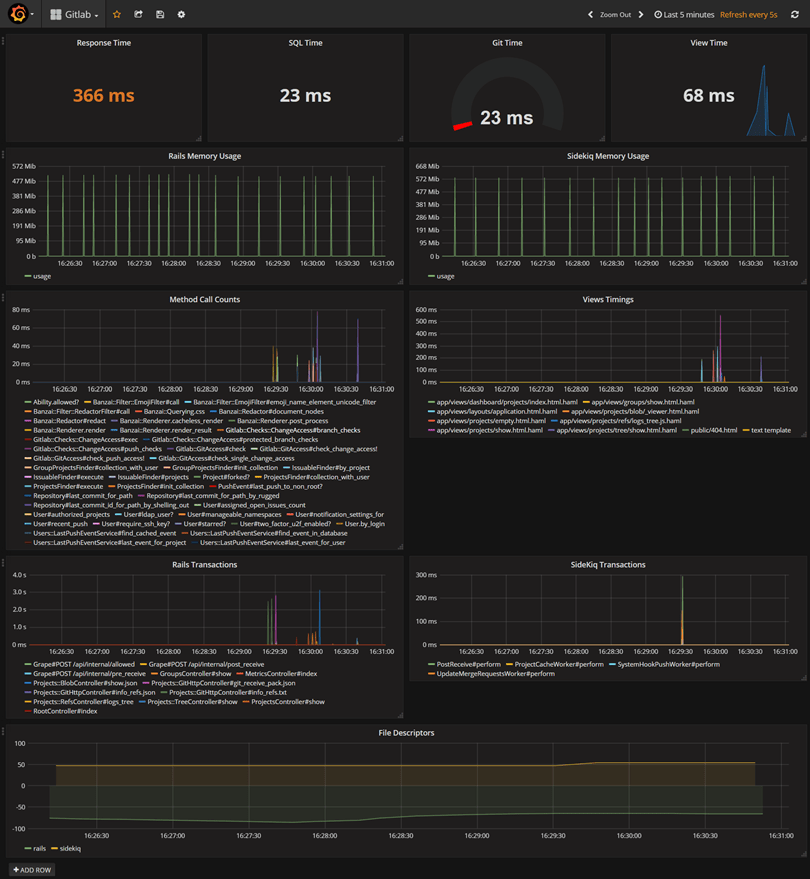
You can now import the dashboard.json file by opening the dashboard dropdown menu and click ‘Import‘ :
Note: Check my GitHub for more interactive & beautiful Grafana dashboards.
Drop your comments, feedback, or suggestions below — or connect with me directly on Twitter @mlabouardy.