AWS Events Analysis with ELK

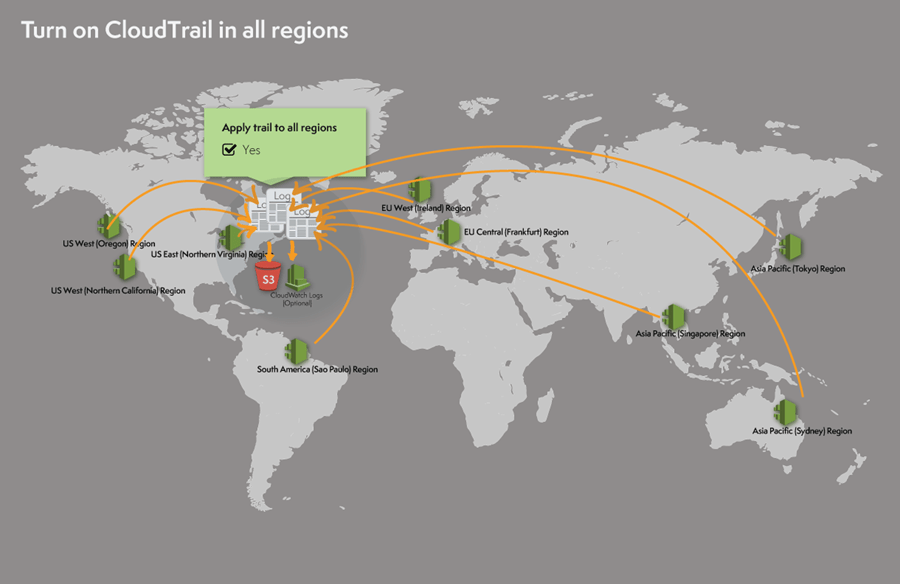
Recording your AWS environment activity is a must have. It can help you monitor your environment’s security continuously and detect suspicious or undesirable activity in real-time. Hence, saving thousands of dollars. Luckily, AWS offers a solution called CloudTrail that allow you to achieve that. It records all events in all AWS regions and logs every API calls in a single S3 bucket.


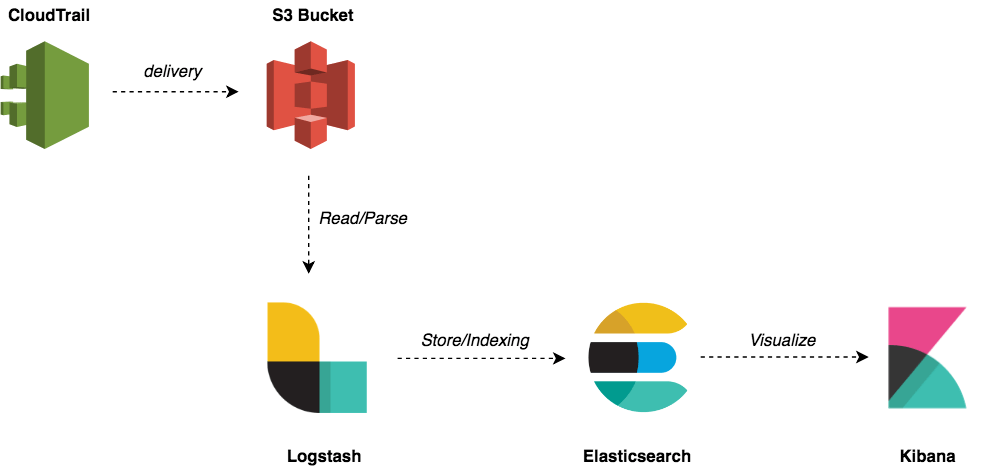
From there, you can setup an analysis pipeline using the popular logging stack ELK (ElasticSearch, Logstash & Kibana) to read those logs, parse, index and visualise them in a single dynamic dashboard and even take actions accordingly:


To get started, create an AMI with the ELK components installed and preconfigured. The AMI will be based on an Ubuntu image:

1
2
3
4
5
6
7
8
9
10
11
12
13
14
15
16
17
18
19
20
21
22
23
24
25
26
27
28
29
30
31
32
33
34
35
36
37
38
39
40
41
42
43
44
{
"variables" : {
"region" : "us-east-1"
},
"builders" : [
{
"type" : "amazon-ebs",
"profile" : "default",
"region" : "{{user `region`}}",
"instance_type" : "t2.xlarge",
"source_ami" : "ami-759bc50a",
"ssh_username" : "ubuntu",
"ami_name" : "elk-stack-6.2.4",
"ami_description" : "ELK Stack",
"run_tags" : {
"Name" : "packer-builder-docker",
"Tool" : "Packer",
"Author" : "mlabouardy"
}
}
],
"provisioners" : [
{
"type" : "file",
"source" : "./elasticsearch.yml",
"destination" : "/tmp/elasticsearch.yml"
},
{
"type" : "file",
"source" : "./cloudtrail.conf",
"destination" : "/tmp/cloudtrail.conf"
},
{
"type" : "file",
"source" : "./kibana.yml",
"destination" : "/tmp/kibana.yml"
},
{
"type" : "shell",
"script" : "./setup.sh",
"execute_command" : "sudo -E -S sh '{{ .Path }}'"
}
]
}

To provision the AMI, we will use the following shell script:

1
2
3
4
5
6
7
8
9
10
11
12
13
14
15
16
17
18
19
20
21
22
23
24
25
26
27
28
29
30
31
32
33
#!/bin/bash

echo "Install Java JDK 8"
apt-get update
apt-get install openjdk-8-jre -y

echo "Install ElasticSearch 6"
wget -qO - https://artifacts.elastic.co/GPG-KEY-elasticsearch | apt-key add -
echo "deb https://artifacts.elastic.co/packages/6.x/apt stable main" | tee -a /etc/apt/sources.list.d/elastic-6.x.list
apt-get update
apt-get install -y elasticsearch
chown -R elasticsearch:elasticsearch /usr/share/elasticsearch
mv /tmp/elasticsearch.yml /etc/elasticsearch/elasticsearch.yml

echo "Start ElasticSearch"
systemctl enable elasticsearch.service
systemctl start elasticsearch.service

echo "Install Logstash"
apt-get install -y apt-transport-https logstash
mv /tmp/cloudtrail.conf /etc/logstash/conf.d/cloudtrail.conf

echo "Start Logstash"
systemctl enable logstash
systemctl start logstash

echo "Install Kibana"
apt-get install -y kibana
mv /tmp/kibana.yml /etc/kibana/kibana.yml

echo "Start Kibana"
systemctl enable kibana
systemctl start kibana

Now the template is defined, bake a new AMI with Packer:

1
packer build ami.json

Once the AMI is created, create a new EC2 instance based on the AMI with Terraform. Make sure to grant S3 permissions to the instance to be able to read CloudTrail logs from the bucket:

1
2
3
4
5
6
7
8
9
10
11
12
13
14
15
16
17
18
19
20
21
22
23
24
25
26
27
28
29
30
31
32
33
34
35
36
37
38
39
40
41
42
43
44
45
46
47
48
49
50
51
52
53
54
55
56
57
58
59
60
61
62
63
64
65
66
67
68
69
70
71
72
73
74
75
76
77
78
79
80
81
82
83
84
85
86
87
88
89
90
91
92
93
94
95
96
97
98
99
100
101
102
103
104
105
106
107
108
109
110
111
112
113
114
115
116
117
118
119
120
provider "aws" {
region = "${var.aws_region}"
}

data "aws_ami" "elk" {
most_recent = true
owners = ["self"]

filter {
name = "state"
values = ["available"]
}

filter {
name = "name"
values = ["elk-stack-6.2.4"]
}
}

resource "aws_security_group" "elk_sg" {
name = "elk_sg"
description = "Allow traffic on elasticsearch & kibana ports"

ingress {
from_port = "22"
to_port = "22"
protocol = "tcp"
cidr_blocks = ["0.0.0.0/0"]
}

ingress {
from_port = "9200"
to_port = "9200"
protocol = "tcp"
cidr_blocks = ["0.0.0.0/0"]
}

ingress {
from_port = "5601"
to_port = "5601"
protocol = "tcp"
cidr_blocks = ["0.0.0.0/0"]
}

egress {
from_port = "0"
to_port = "0"
protocol = "-1"
cidr_blocks = ["0.0.0.0/0"]
}

tags {
Name = "elk_sg"
Author = "mlabouardy"
Tool = "Terraform"
}
}

resource "aws_iam_role_policy" "cloudtrail_bucket_access_policy" {
name = "CloudTrailEventsBucketFullAccessPolicy"
role = "${aws_iam_role.cloudtrail_bucket_access_role.id}"

policy = <<EOF
{
"Version": "2012-10-17",
"Statement": [
{
"Action": [
"s3:*"
],
"Effect": "Allow",
"Resource": "arn:aws:s3:::cloudtrail-demo-2018"
}
]
}
EOF
}

resource "aws_iam_role" "cloudtrail_bucket_access_role" {
name = "CloudTrailEventsBucketFullAccessRole"

assume_role_policy = <<EOF
{
"Version": "2012-10-17",
"Statement": [
{
"Action": "sts:AssumeRole",
"Principal": {
"Service": "ec2.amazonaws.com"
},
"Effect": "Allow",
"Sid": ""
}
]
}
EOF
}

resource "aws_iam_instance_profile" "cloudtrail_bucket_access_profile" {
name = "cloudtrail_bucket_access_profile"
role = "${aws_iam_role.cloudtrail_bucket_access_role.name}"
}

resource "aws_instance" "elk" {
key_name = "${var.key_name}"
instance_type = "${var.instance_type}"
ami = "${data.aws_ami.elk.id}"
security_groups = ["${aws_security_group.elk_sg.name}"]
iam_instance_profile = "${aws_iam_instance_profile.cloudtrail_bucket_access_profile.name}"

root_block_device {
volume_size = 100
}

tags {
Name = "elk"
Author = "mlabouardy"
Tool = "Terraform"
}
}

Issue the following command to provision the infrastructure:

1
terraform apply

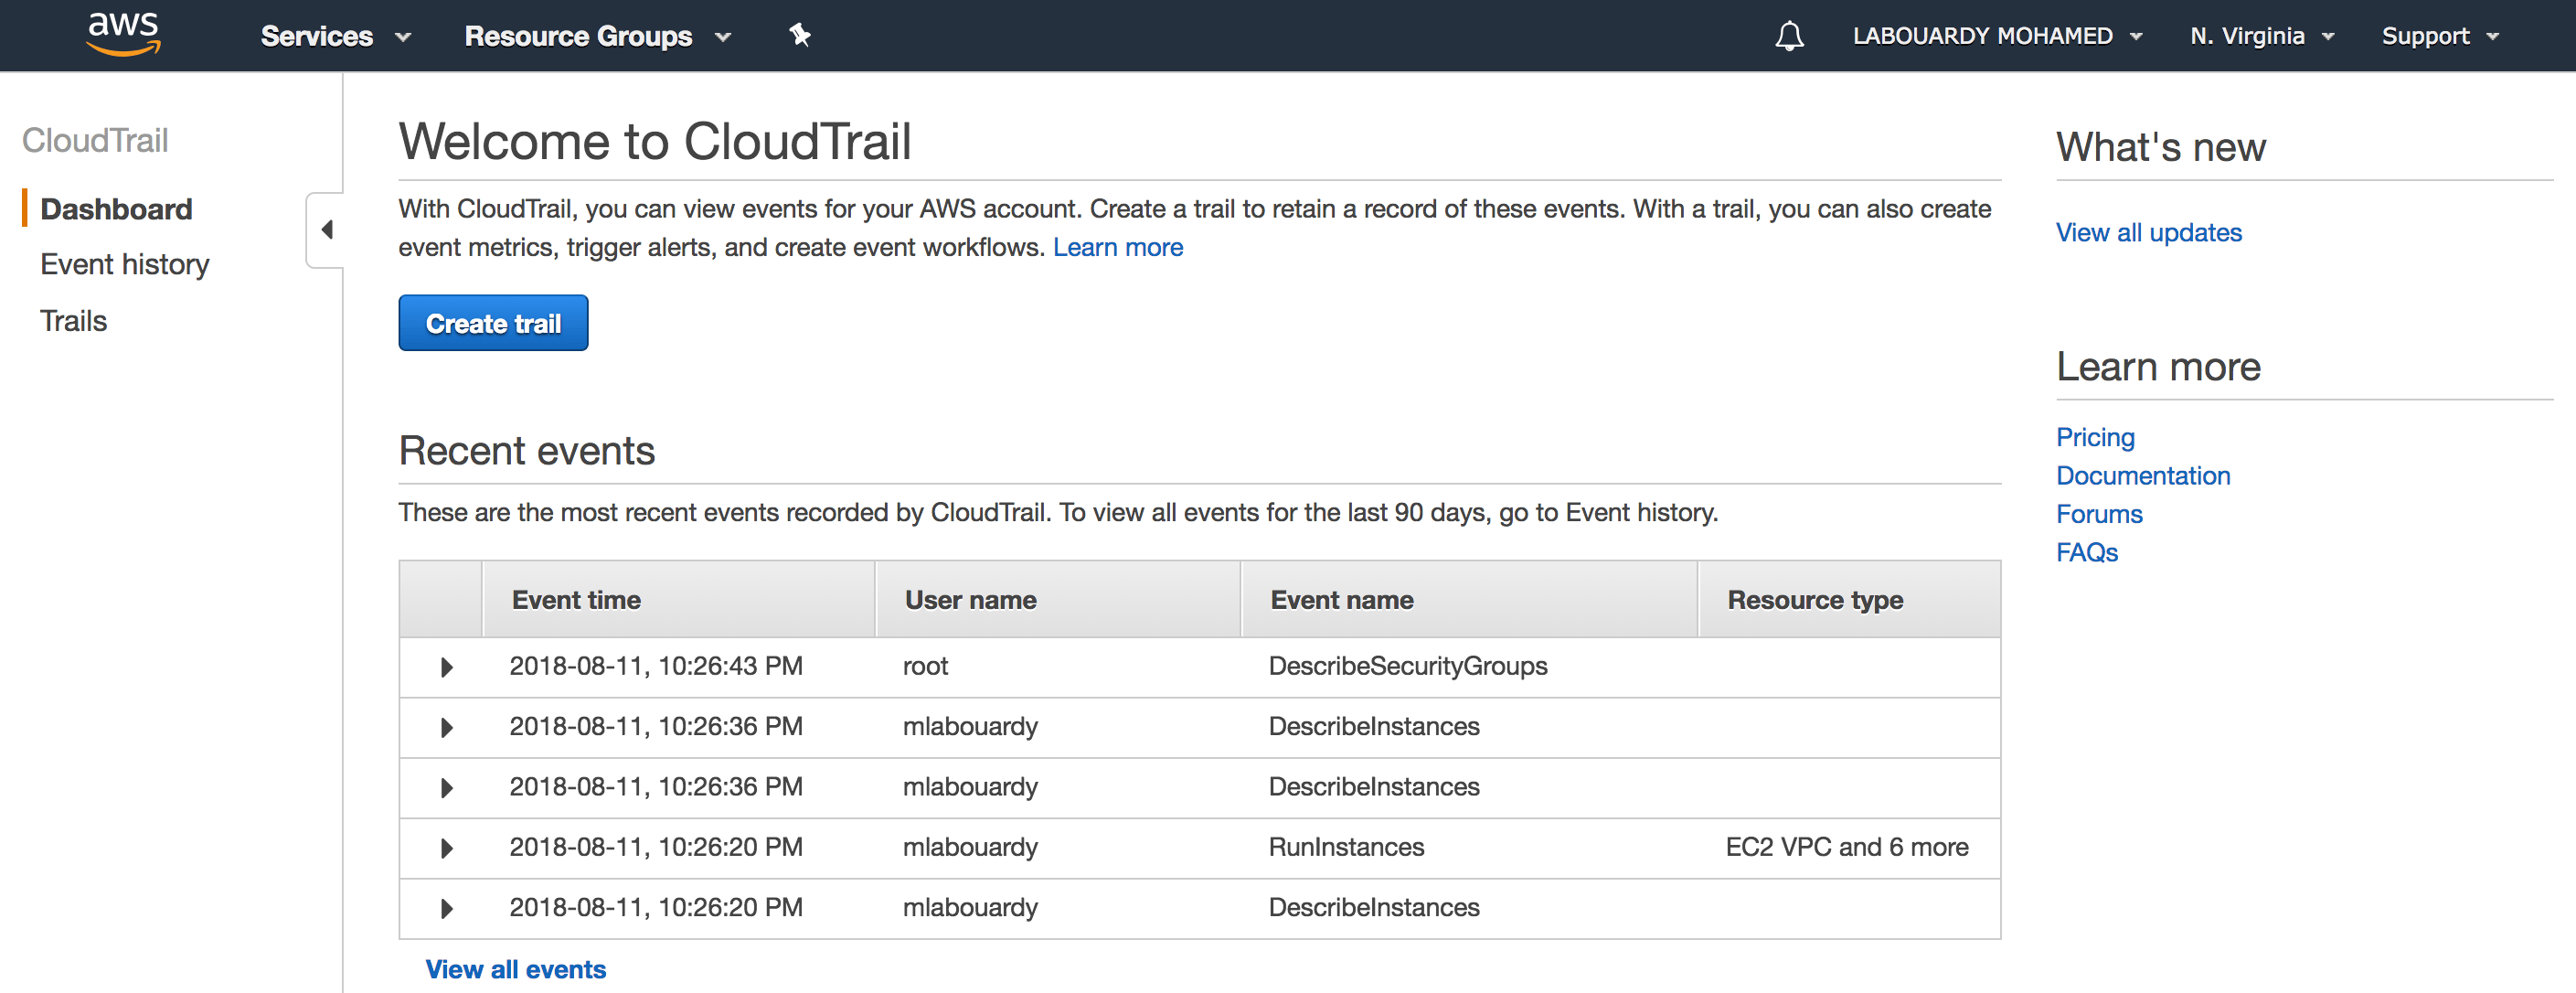
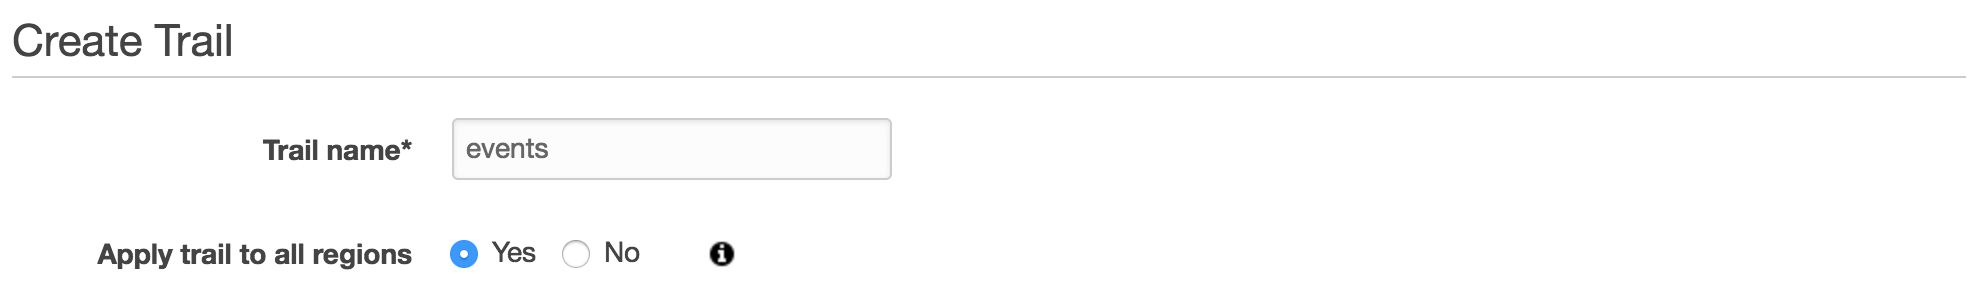
Head back to AWS Management Console, navigate to CloudTrail, and click on “Create Trail” button:


Give it a name and apply the trail to all AWS regions:


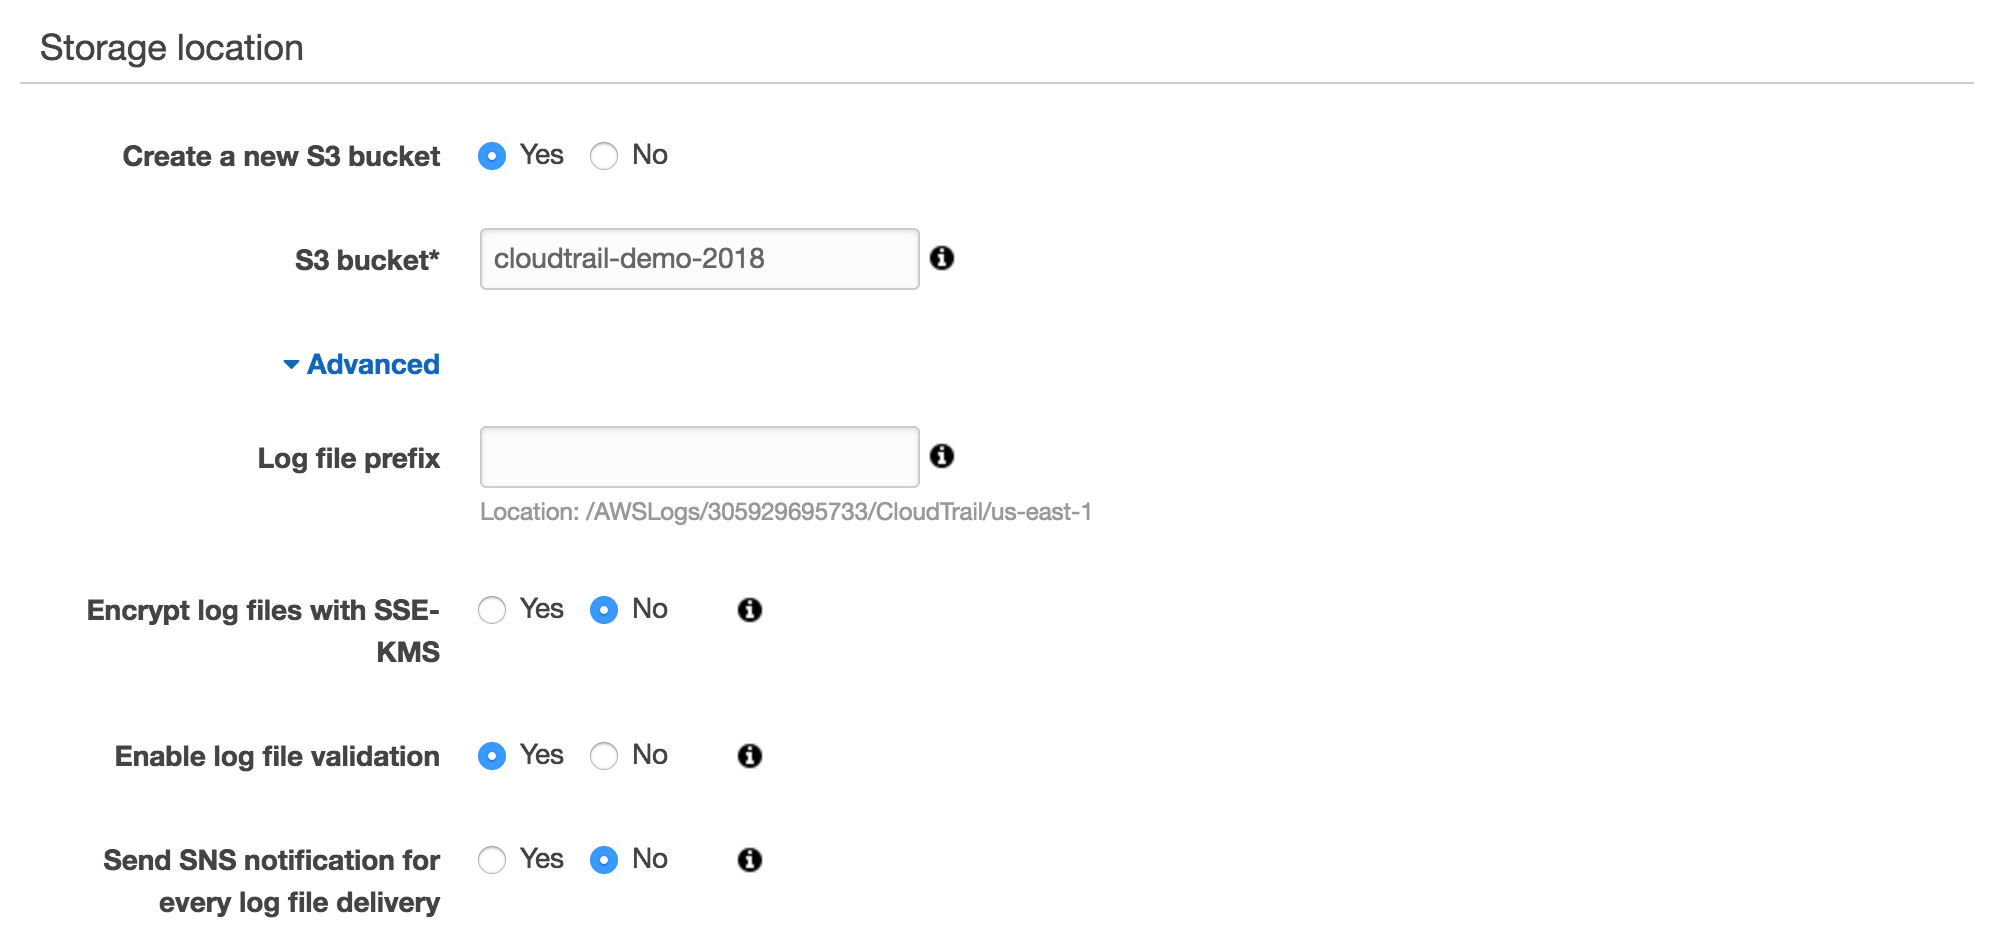
Next, create a new S3 bucket on which the events will be stored on:


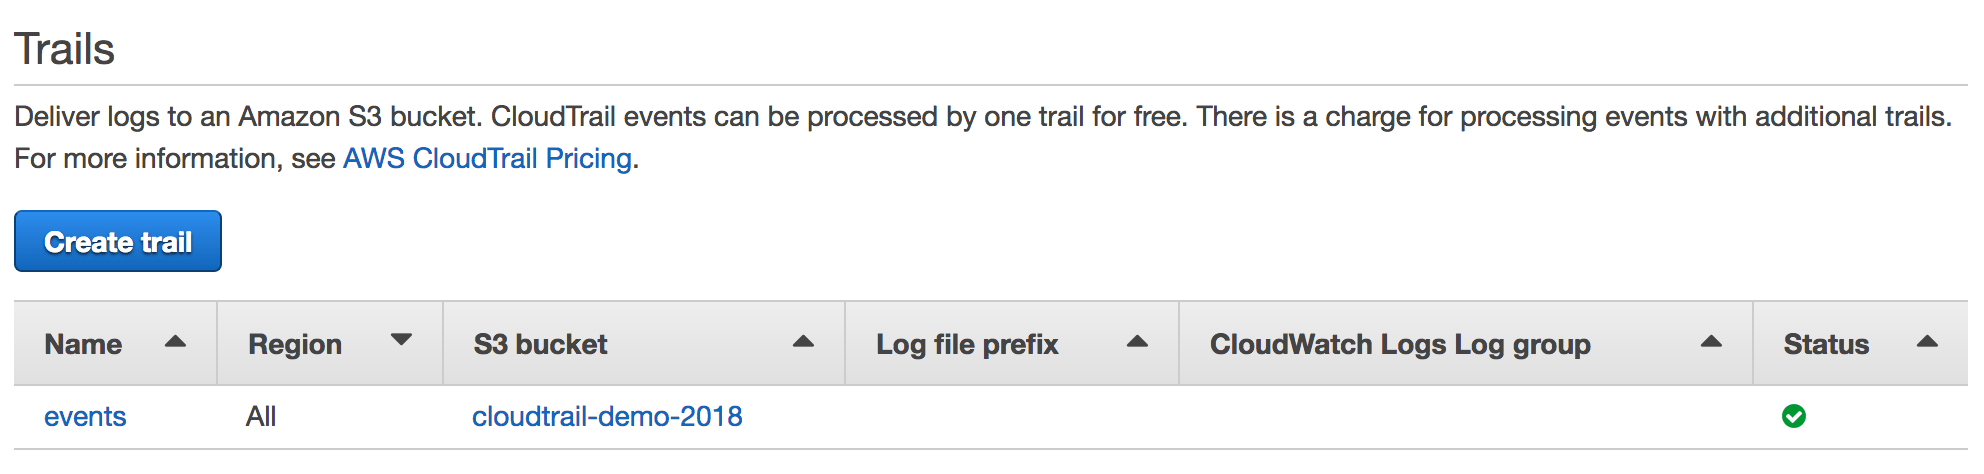
Click on “Create“, and the trail should be created as follows:


Next, configure Logstash to read CloudTrail logs on an interval basis. The geoip filter adds information about the geographical location of IP addresses, based on sourceIPAddress field. Then, it stores the logs to Elasticsearch automatically:

1
2
3
4
5
6
7
8
9
10
11
12
13
14
15
16
17
18
19
20
21
22
23
24
25
26
27
28
input {
s3 {
"bucket" => "cloudtrail-demo-2018"
}
}

filter {
json {
source => "message"
}

split {
field => "Records"
}

geoip {
source => "[Records][sourceIPAddress]"
target => "geoip"
add_tag => [ "cloudtrail-geoip" ]
}
}

output {
elasticsearch {
hosts => 'http://localhost:9200'
index => 'cloudtrail-%{+YYYY.MM.dd}'
}
}

In order for the changes to take effect, restart Logstash with the command below:

1
service restart logstash

A new index should be created on Elasticsearch (http://IP:9200/_cat/indices?v)


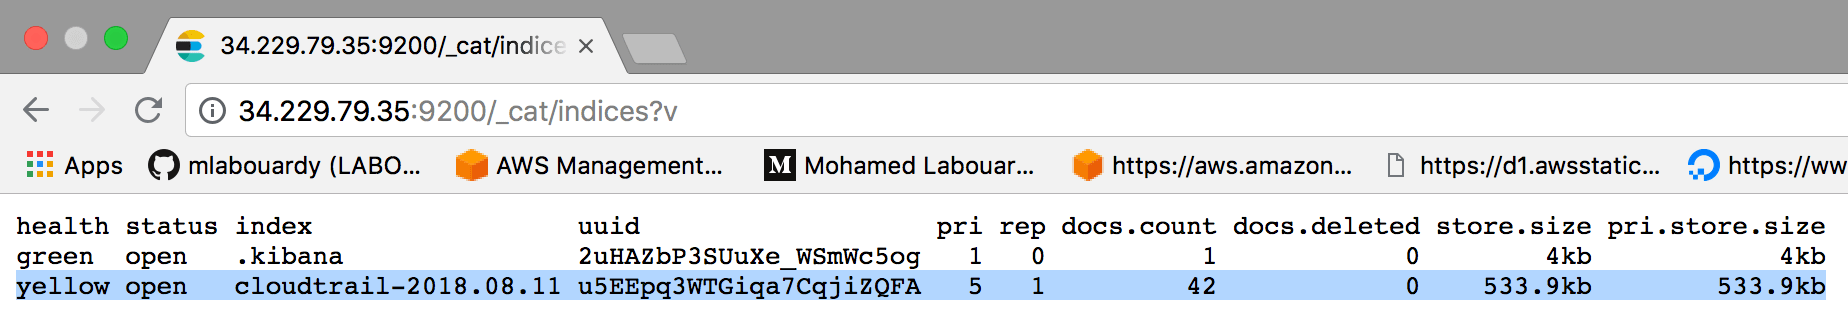
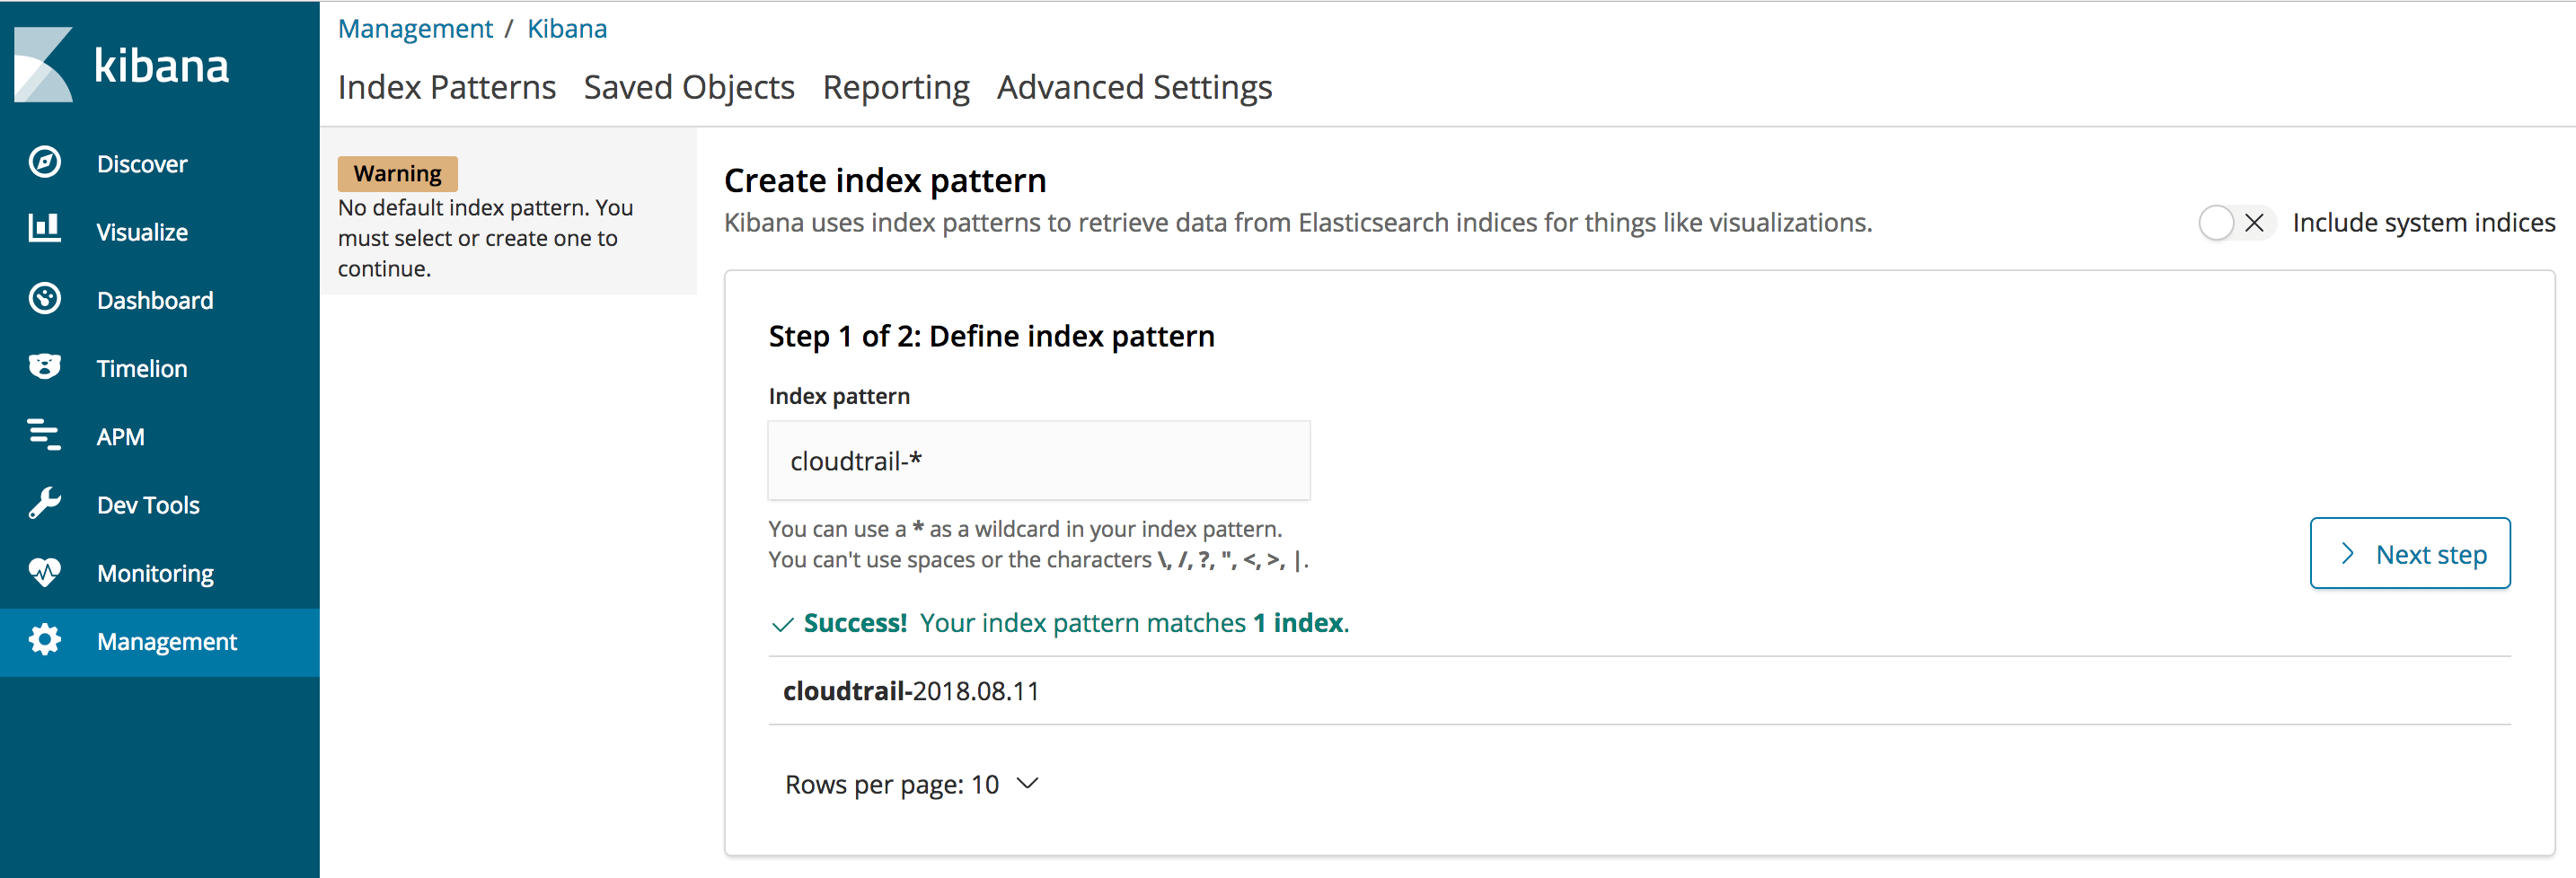
On Kibana, create a new index pattern that match the index format used to store the logs:


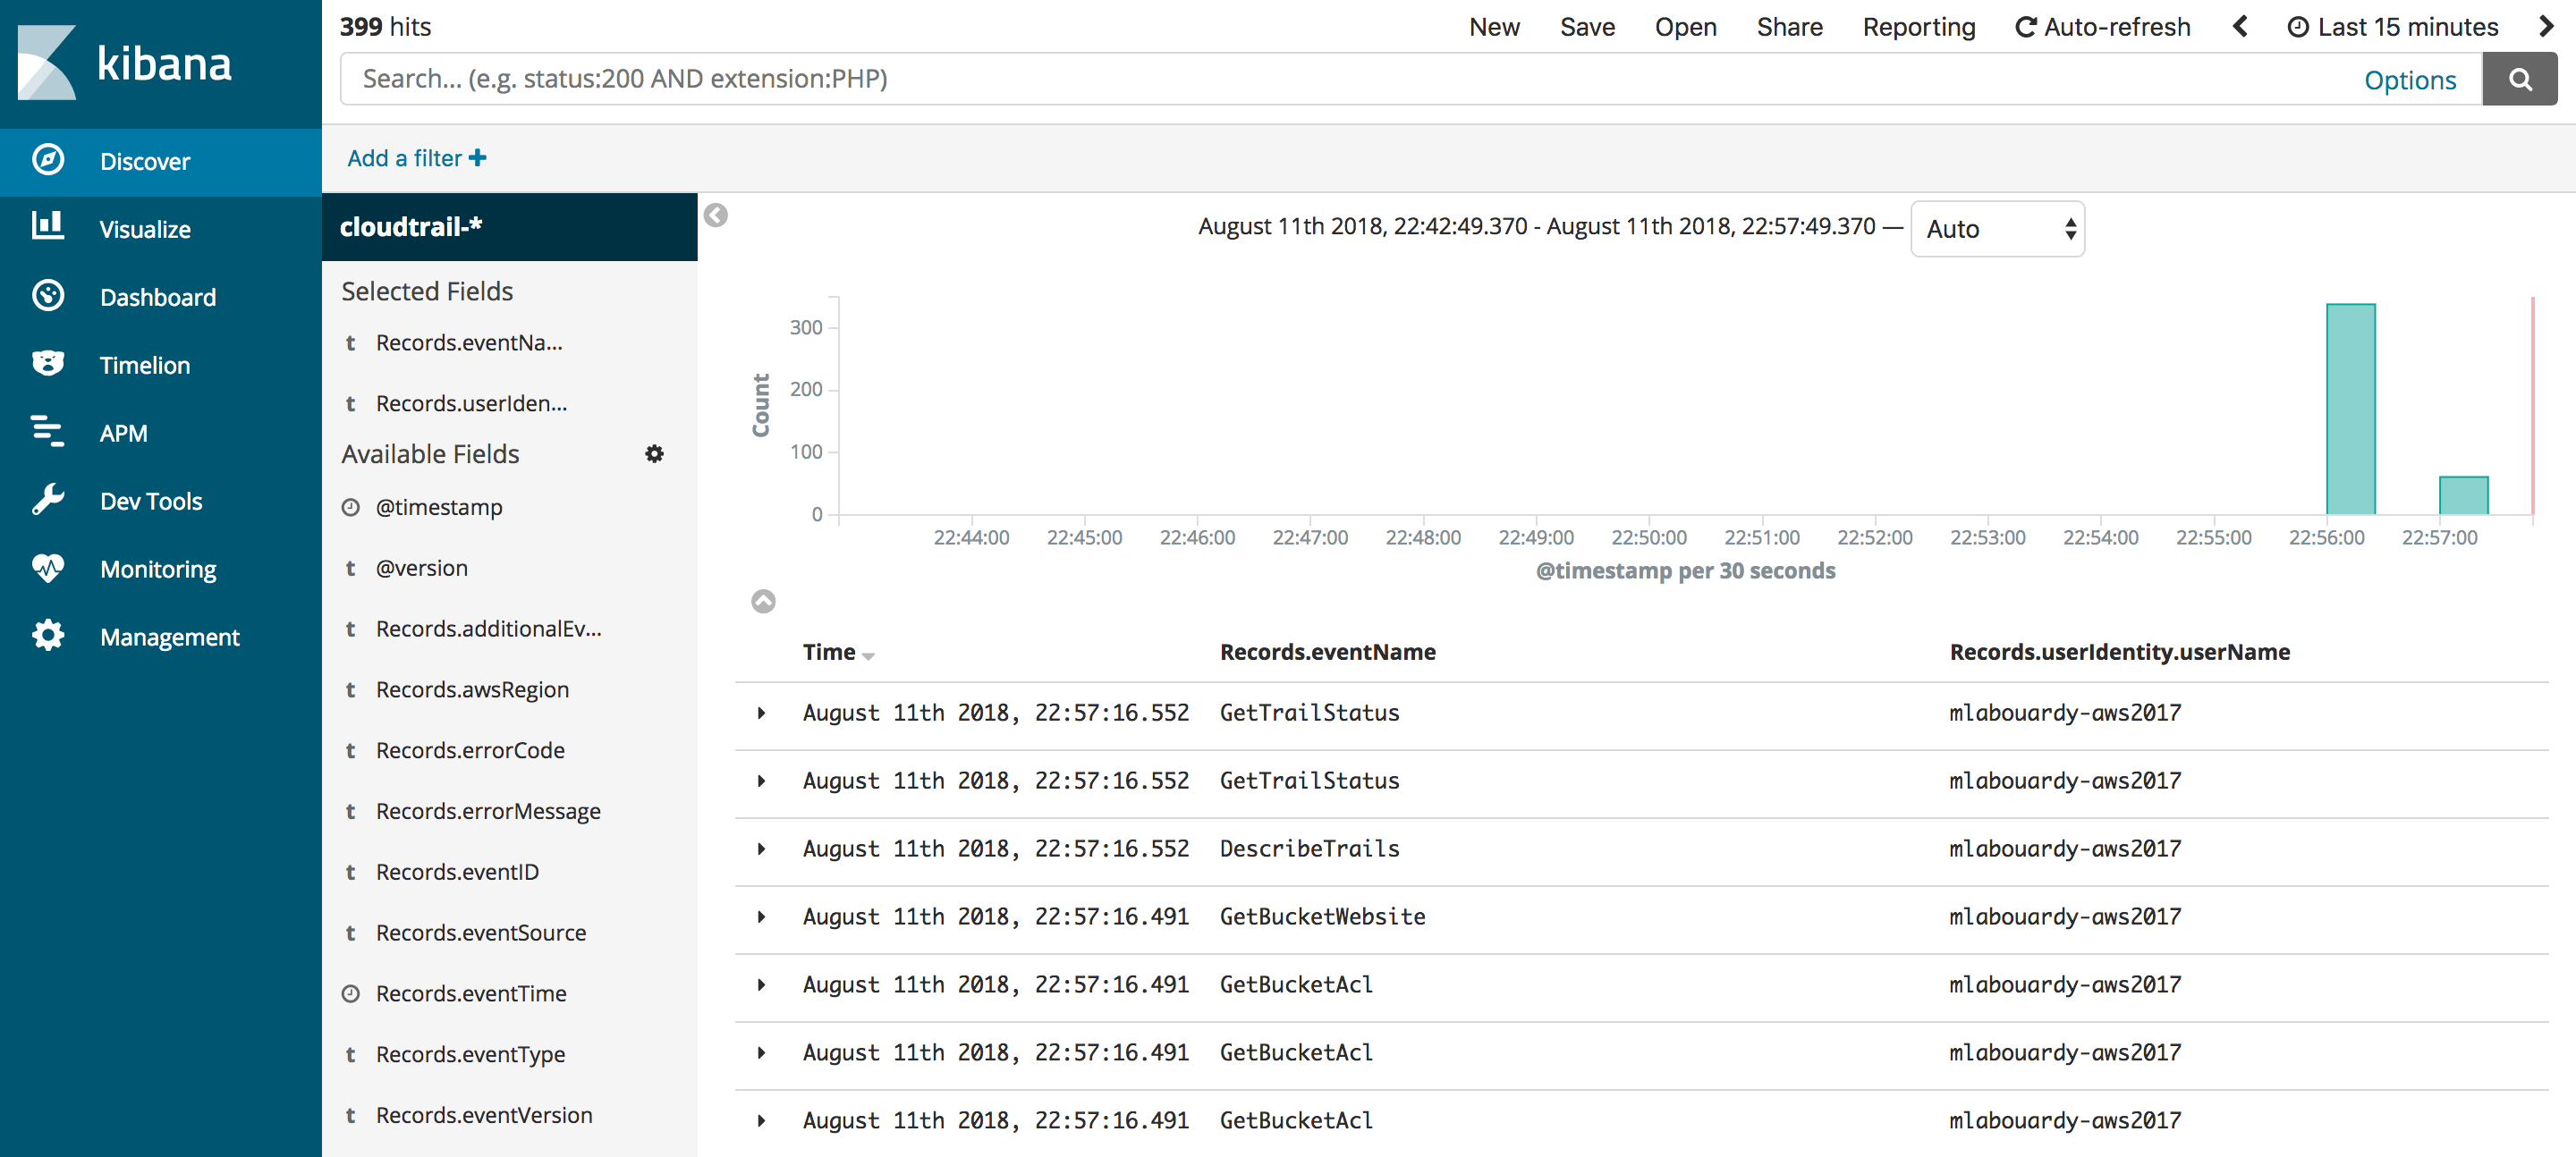
After creating index, we can start exploring our CloudTrail events:


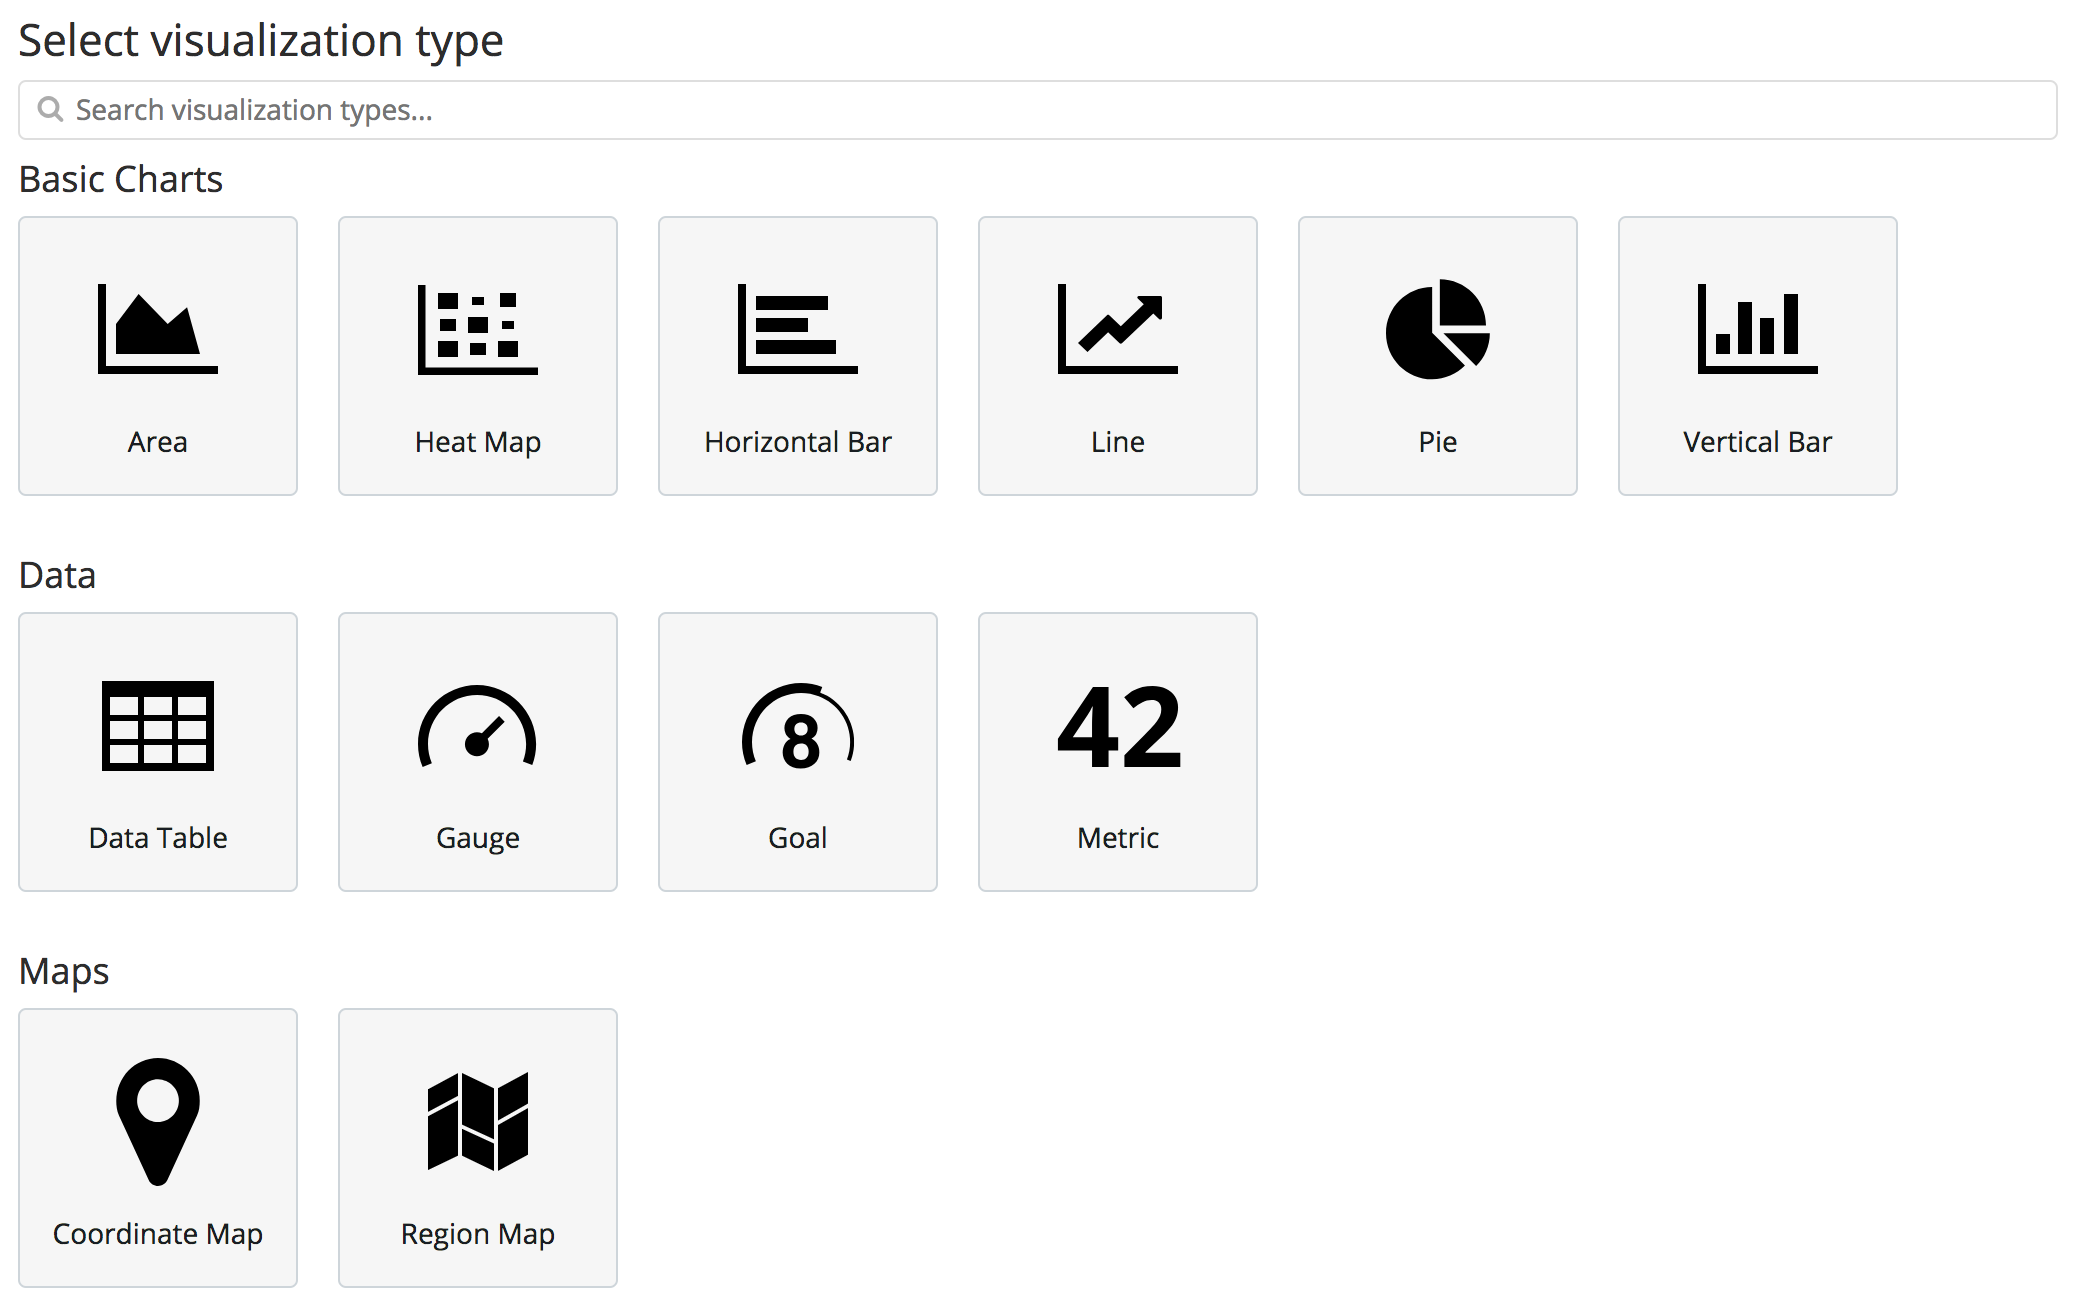
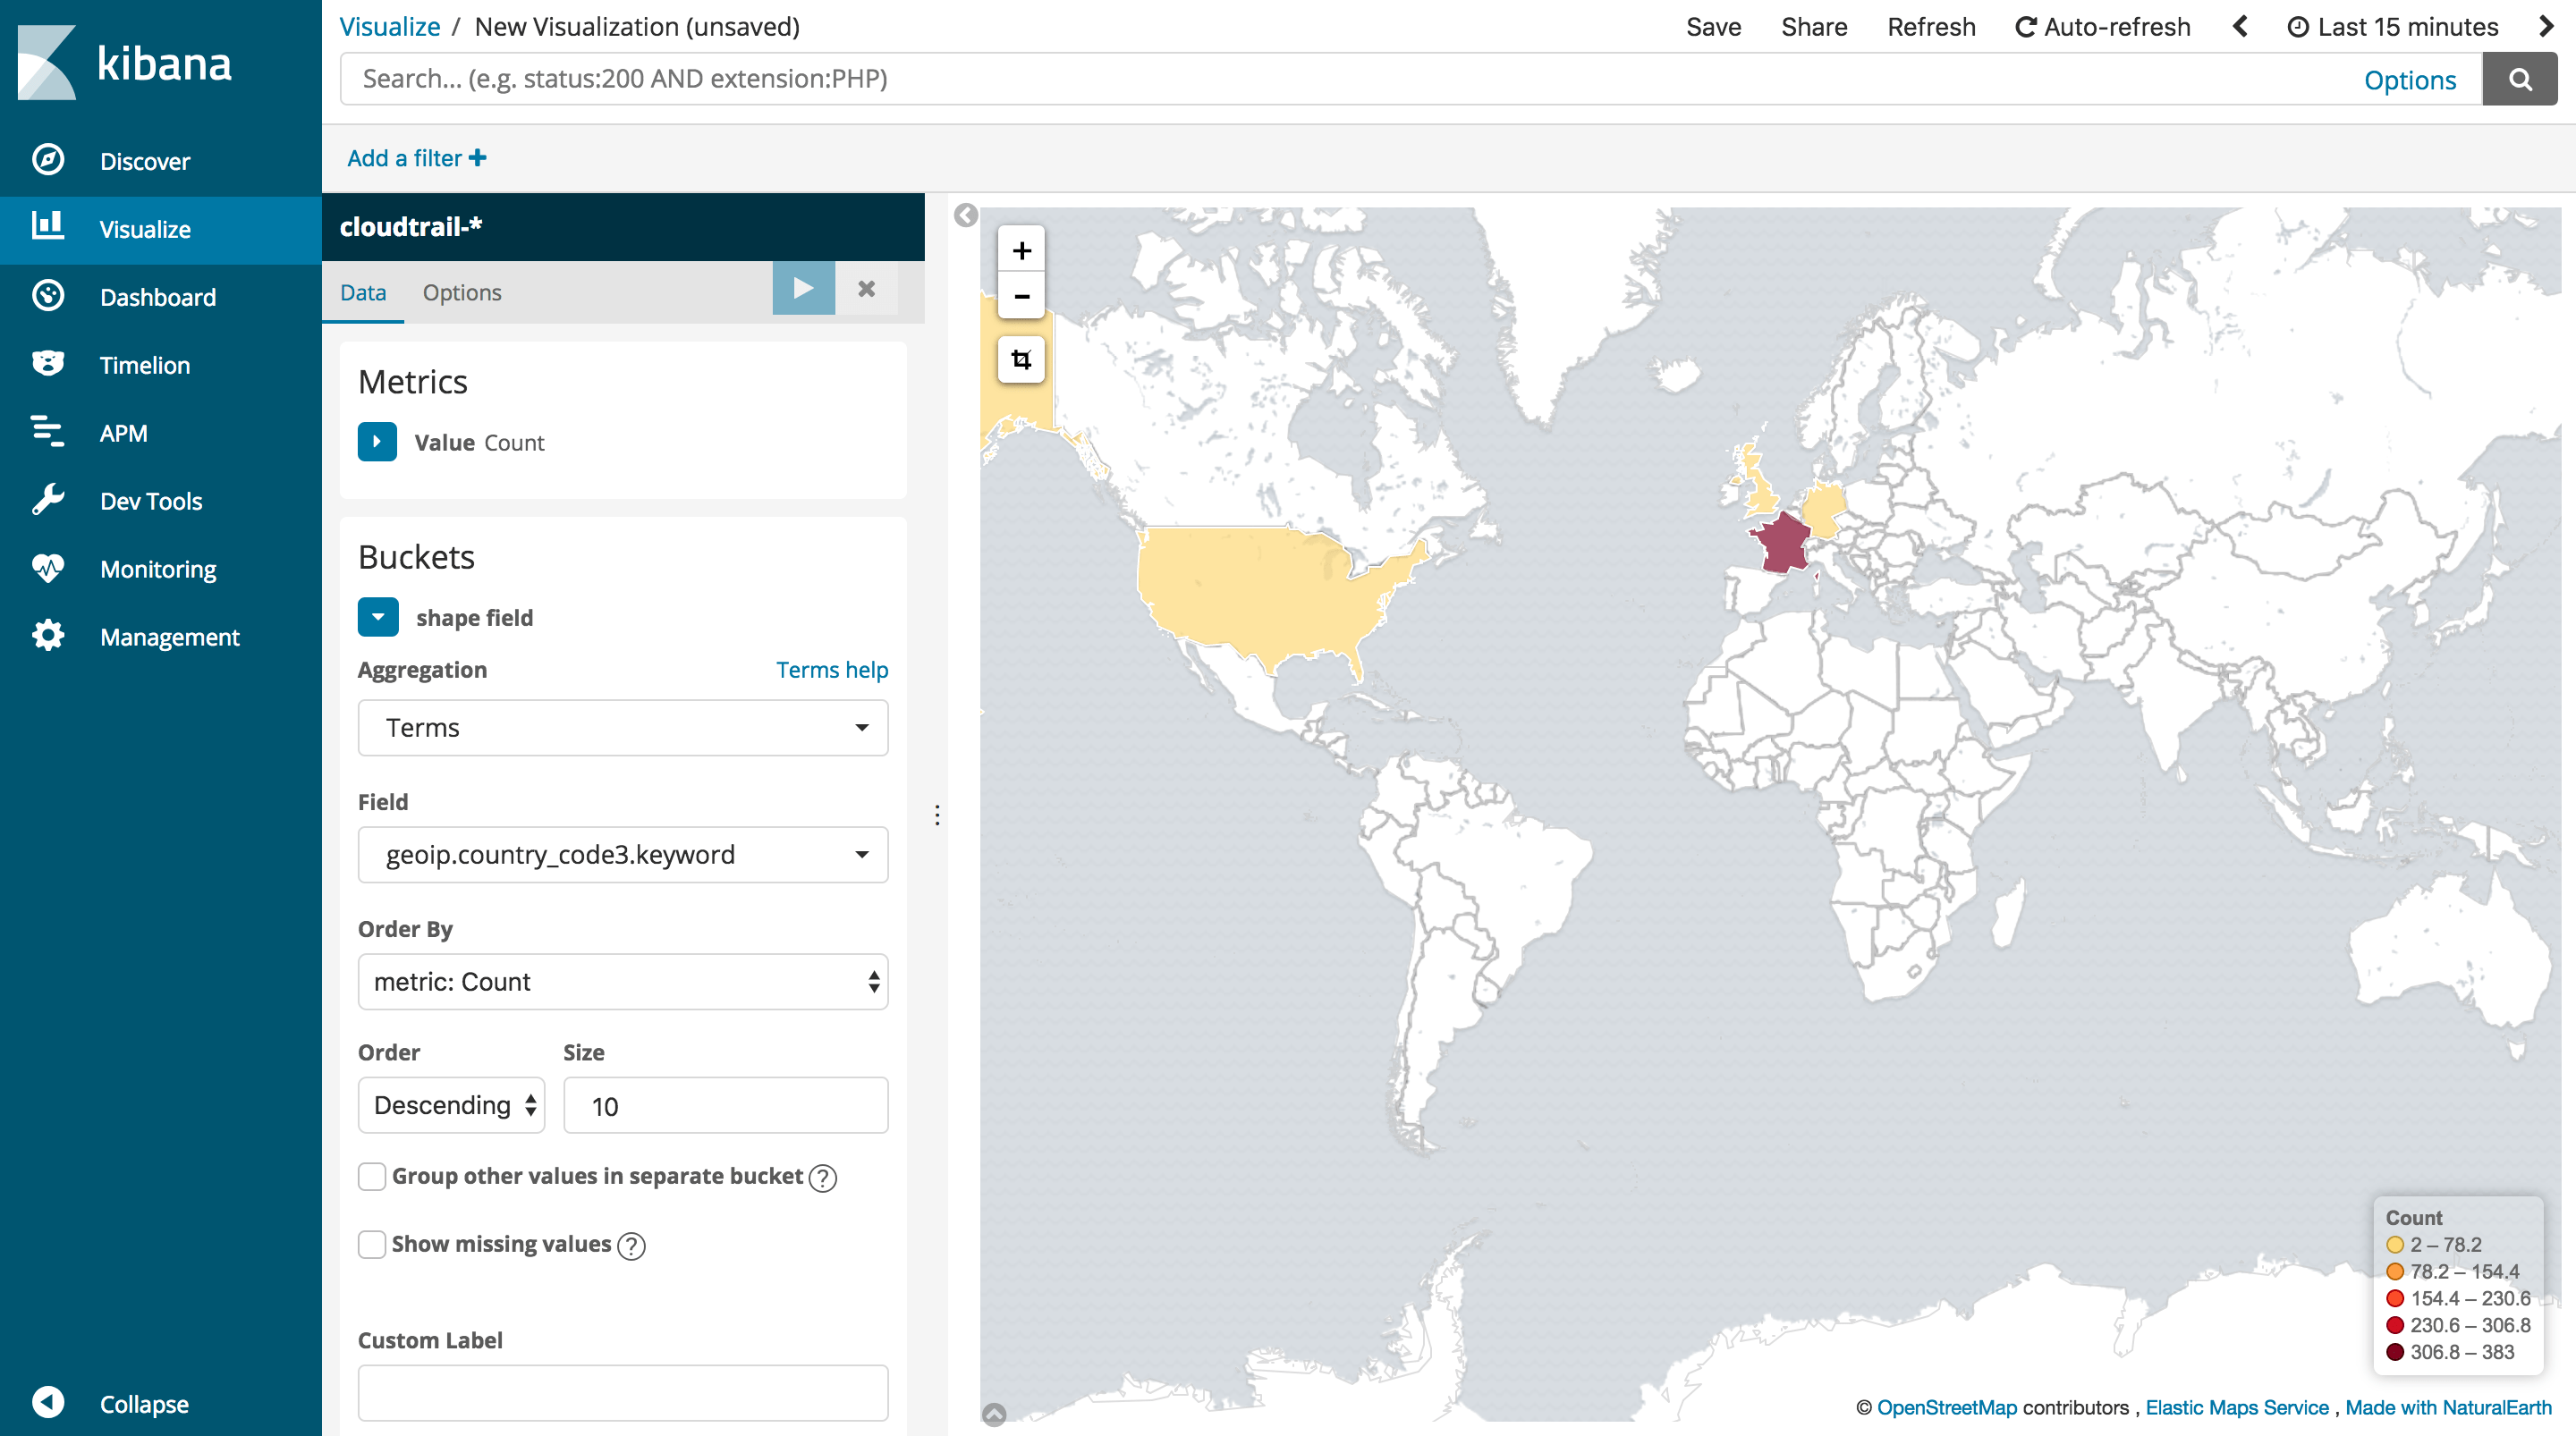
Now that we have processed data inside Elasticsearch, let’s build some graphs. We will use the Map visualization in Kibana to monitor geo access to our AWS environment:


You can now see where the environment is being accessed from:


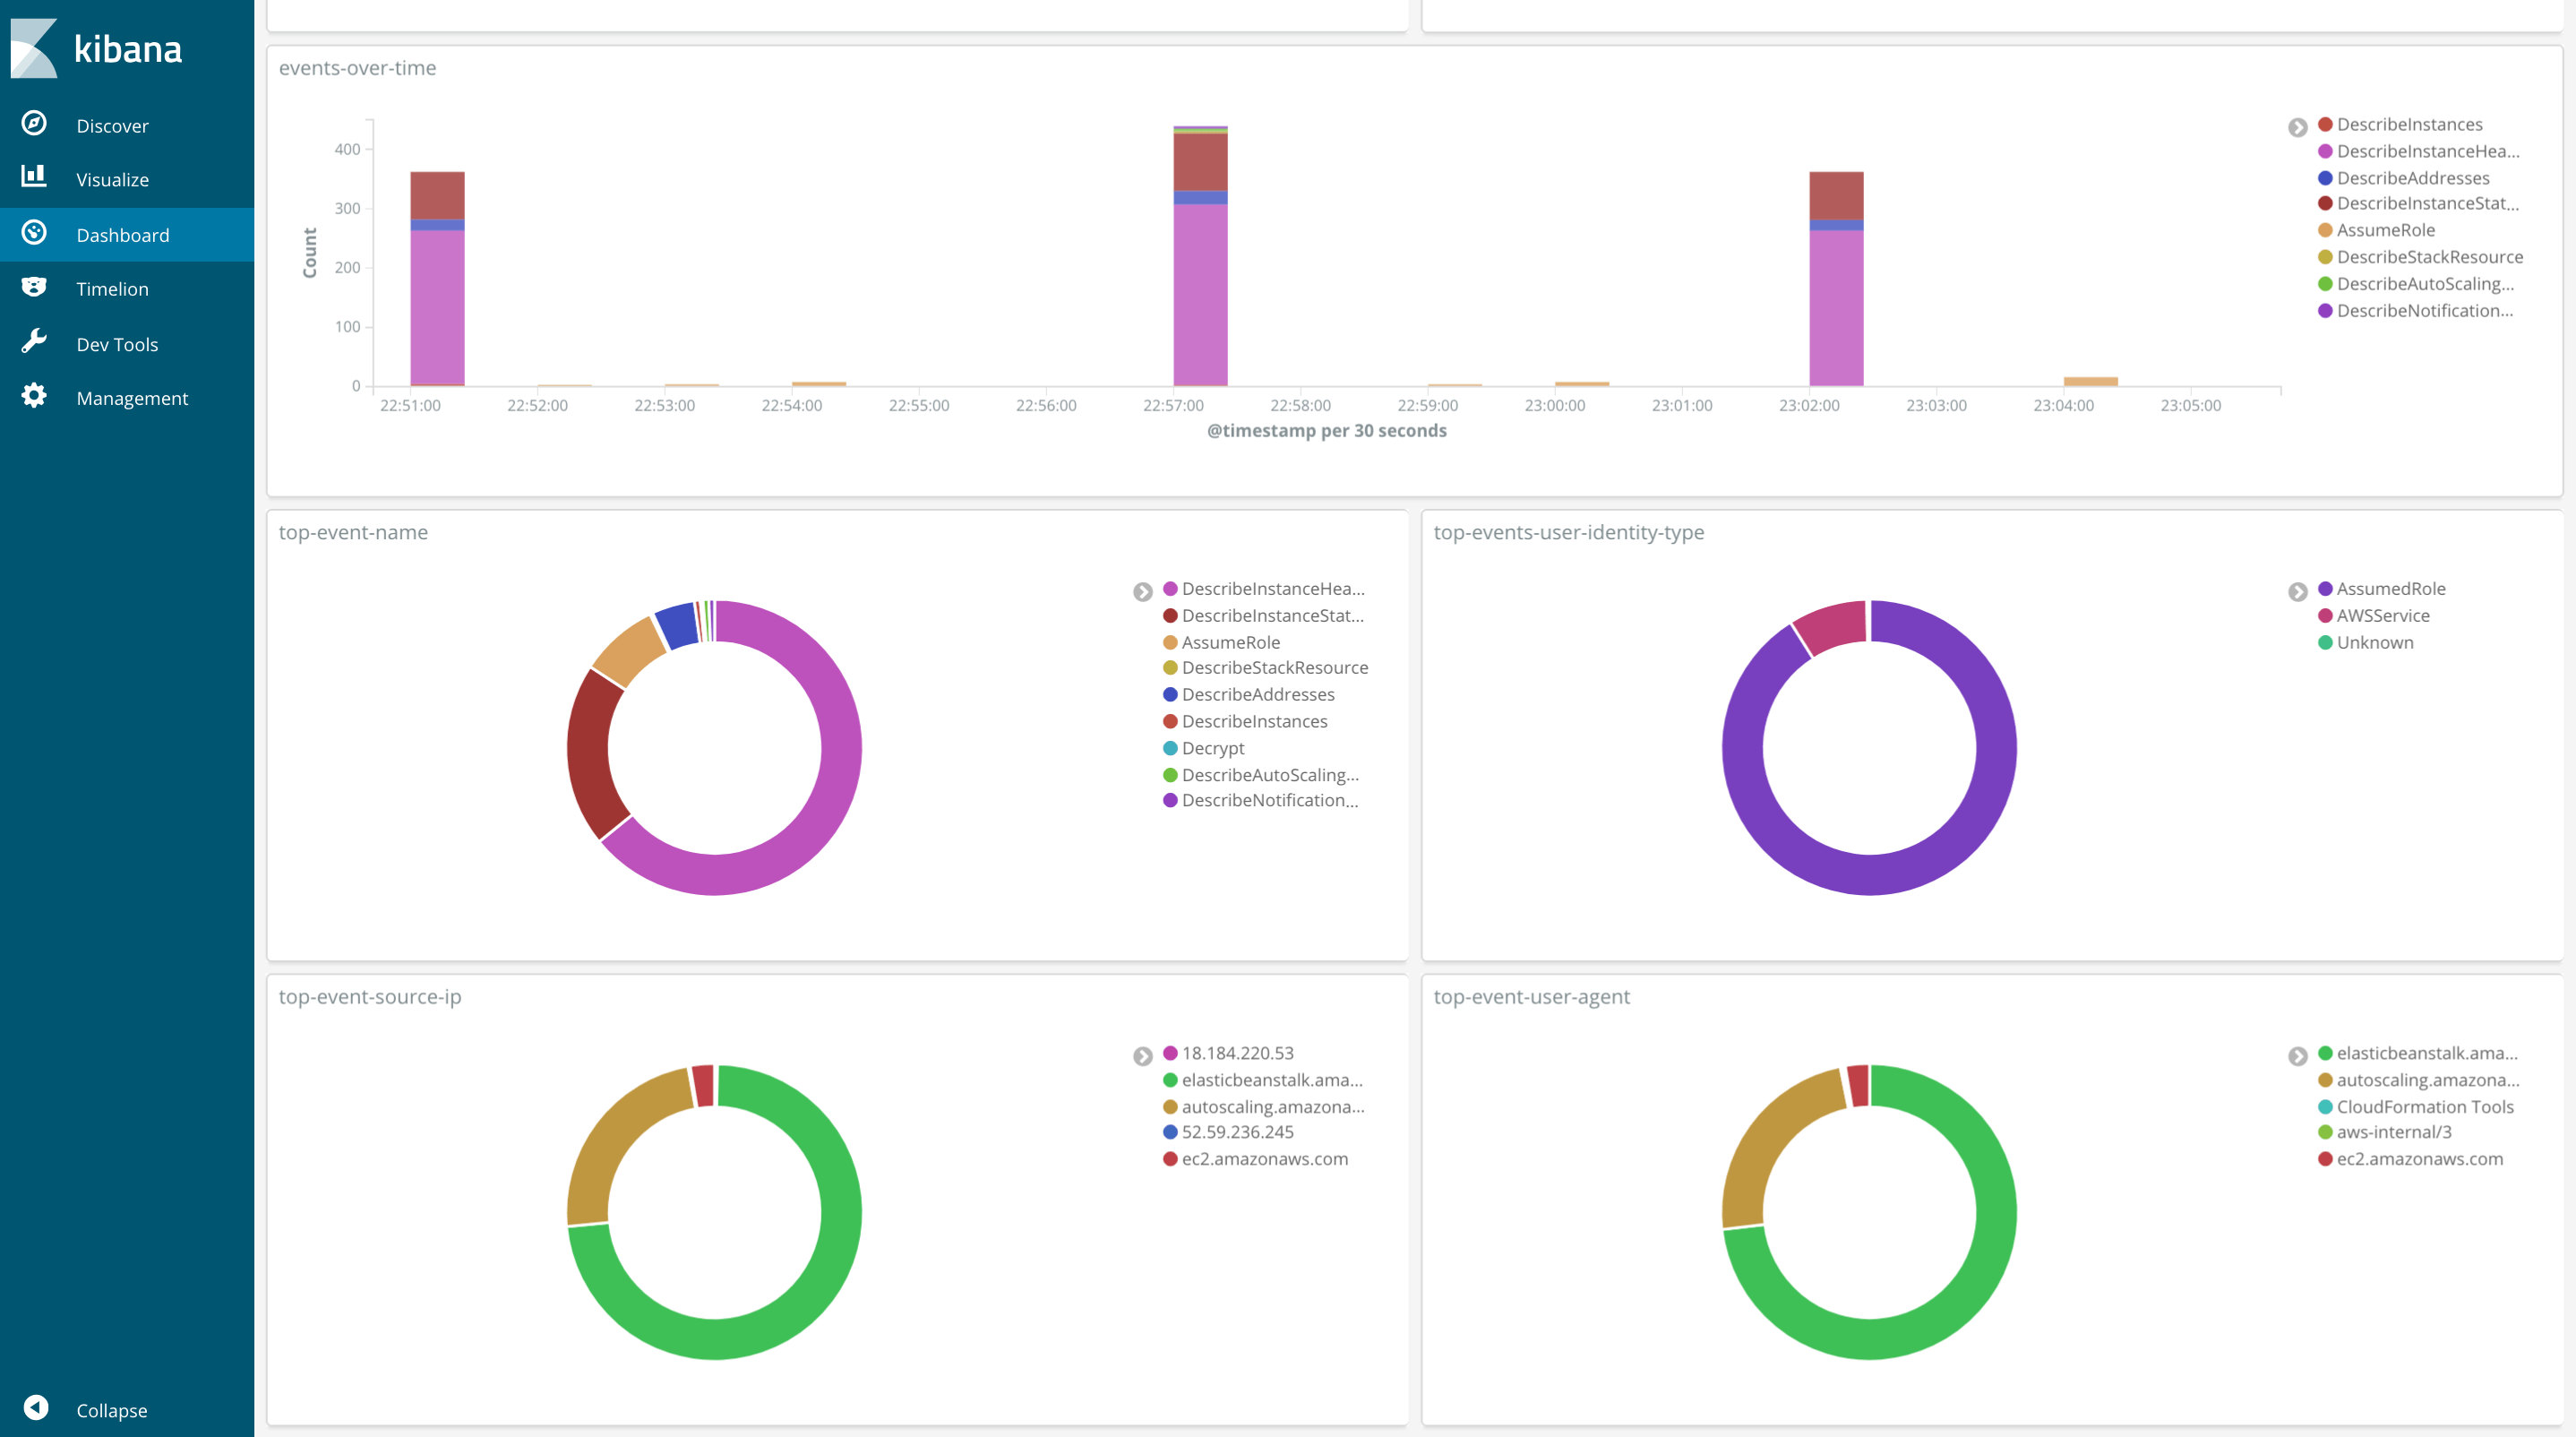
Next, create more widgets to display information about the identity of the user, the user agent and actions taken by the user. Which will look something like this:


You can take this further and setup alerts based on specific event (someone accesses your environment from an undefined location) to be alerted in near real-time.

Full code can be found on my GitHub. Make sure to drop your comments, feedback, or suggestions below — or connect with me directly on Twitter @mlabouardy.

Your browser is out-of-date!

Update your browser to view this website correctly. Update my browser now

×