


In my previous post, your learnt how to monitor your Swarm Cluster with TICK Stack. In this part, I will show you how to use the same Stack but instead of using Chronograf as our visualization and exploration tool we will use Grafana.
Connect to your manager node via SSH, and clone the following GitHub repository:
1 | git clone https://github.com/mlabouardy/swarm-tig.git |
Use the docker-compose.yml below to setup the monitoring stack:
1 | version: "3.3" |
Then, issue the following command to deploy the stack:
1 | docker stack deploy --compose-file docker-compose.yml tig |
Once deployed, you should see the list of services running on the cluster:

Point your browser to http://IP:3000, you should be able to reach the Grafana Dashboard:
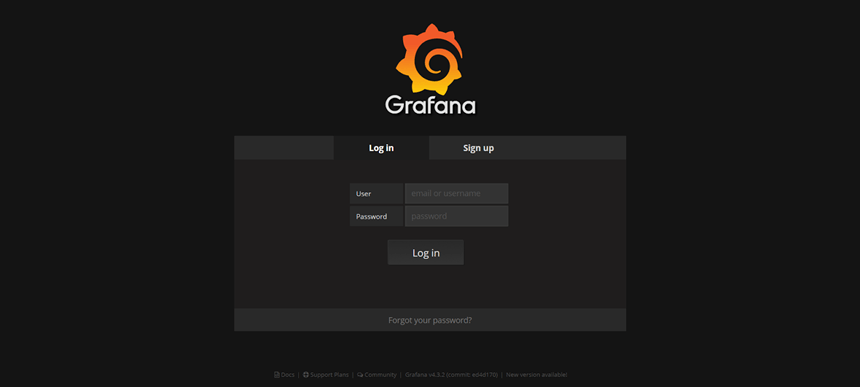
The default username & password are admin. Go ahead and log in.
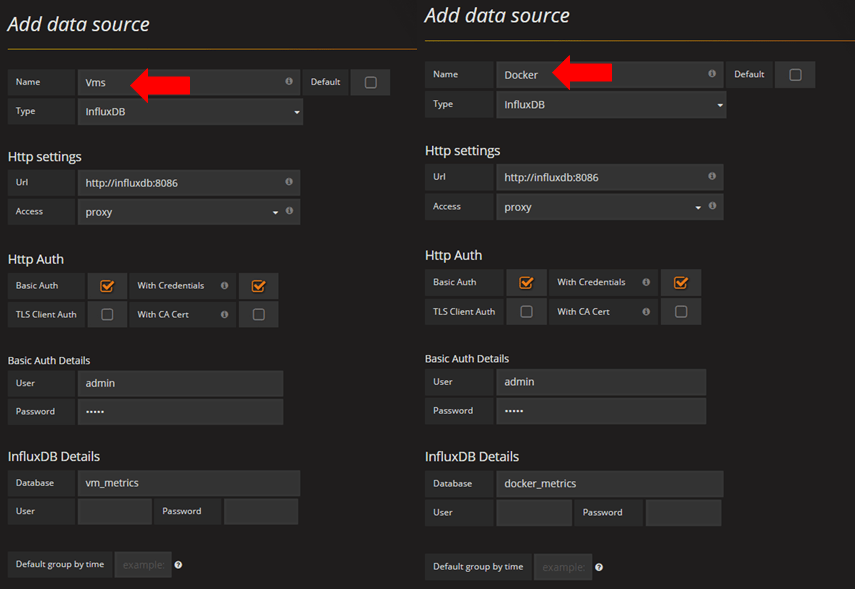
Go to “Data Sources” and create 2 InfluxDB data sources:
- Vms: pointing to your Cluster Nodes metrics database.
- Docker: pointing to your Docker Services metrics database.
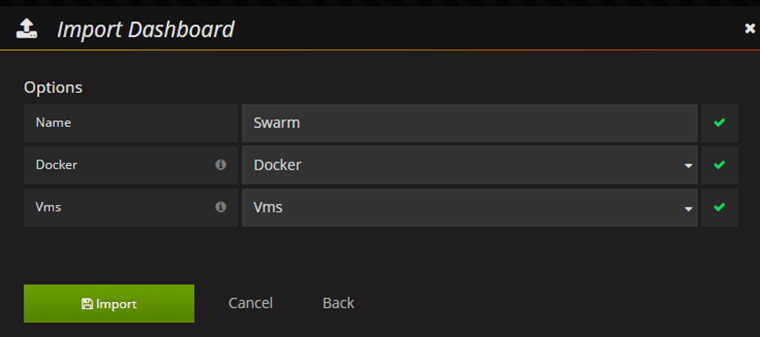
Finally, import the dashboard by hitting the “import” button:
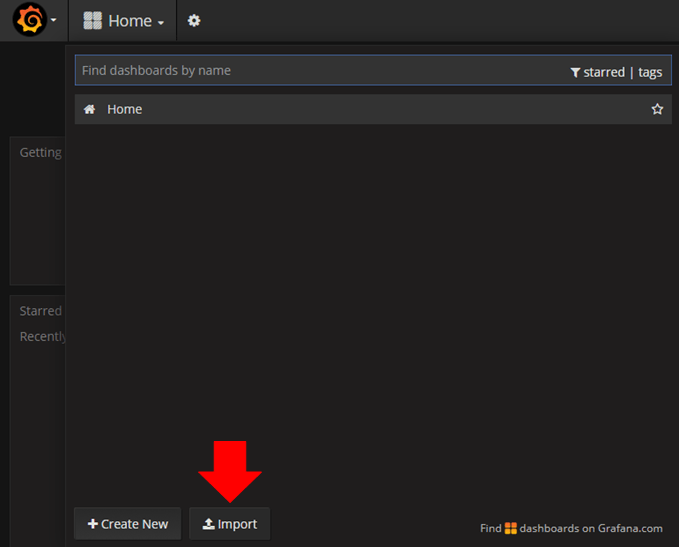
From here, you can upload the dashboard.json, then pick the data sources you created earlier:
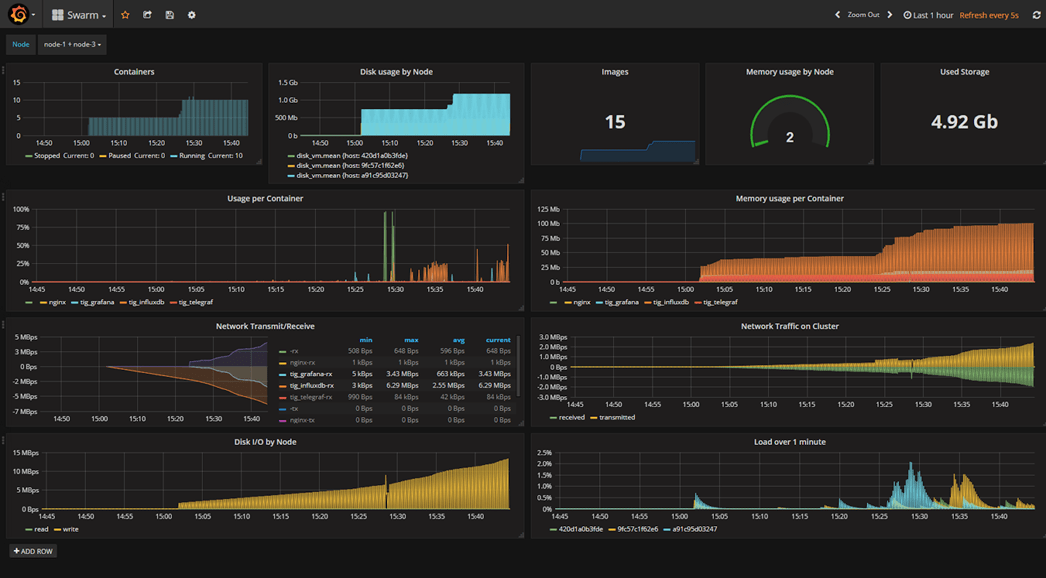
You will end up with an interactive and dynamic dashboard:
Drop your comments, feedback, or suggestions below — or connect with me directly on Twitter @mlabouardy.