


AWS Autoscaling Groups can only scale in response to metrics in CloudWatch and most of the default metrics are not sufficient for predictive scaling. That’s why you need to publish your custom metrics to CloudWatch.
I was surfing the internet as usual, and I couldn’t find any post talking about how to publish custom metrics to AWS CloudWatch, and because I’m a Gopher, I got my hand dirty and I wrote my own script in Go.
You can publish your own metrics to CloudWatch using the AWS Go SDK:
1 | func Publish(metricData []cloudwatch.MetricDatum, namespace string) { |
To collect metrics about memory for example, you can either parse output of command ‘free -m’ or use a third-party library like gopsutil:
1 | memoryMetrics, err := mem.VirtualMemory() |
The memoryMetrics object expose multiple metrics:
- Memory used
- Memory available
- Buffers
- Swap cached
- Page Tables
- etc
Each metric will be published with an InstanceID dimension. To get the instance id, you can query the meta-data:
1 | func GetInstanceID() (string, error) { |

What if I’m not a Gopher ? well, don’t freak out, I built a simple CLI which doesn’t require any Go knowledge or dependencies to be installed (AWS CloudWatch Monitoring Scripts requires Perl dependencies) and moreover it’s cross-platform.
The CLI collects the following metrics:
- Memory: utilization, used, available.
- Swap: utilization, used, free.
- Disk: utilization, used, available.
- Network: packets in/out, bytes in/out, errors in/out.
- Docker: memory & cpu per container.
The CLI have been tested on instances using the following AMIs (64-bit versions):
- Amazon Linux
- Amazon Linux 2
- Ubuntu 16.04
- Microsoft Windows Server
To get started, find the appropriate package for your instance and download it. For linux:
1 | wget https://s3.us-east-1.amazonaws.com/mon-put-instance-data/1.0.0/linux/mon-put-instance-data |
After you install the CLI, you may need to add the path to the executable file to your PATH variable. Then, issue the following command:
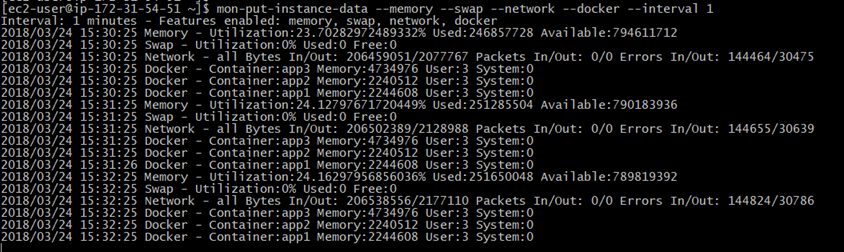
1 | mon-put-instance-data --memory --swap --network --docker --interval 1 |
The command above will collect memory, swap, network & docker containers resource utilization on the current system.
Note: ensure an IAM role is associated with your instance, verify that it grants permission to perform cloudwatch:PutMetricData.
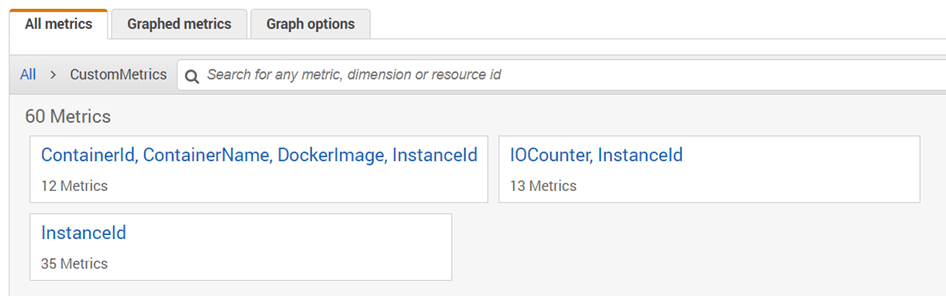
Now that we’ve written custom metrics to CloudWatch. You can view statistical graphs of your published metrics with the AWS Management Console:
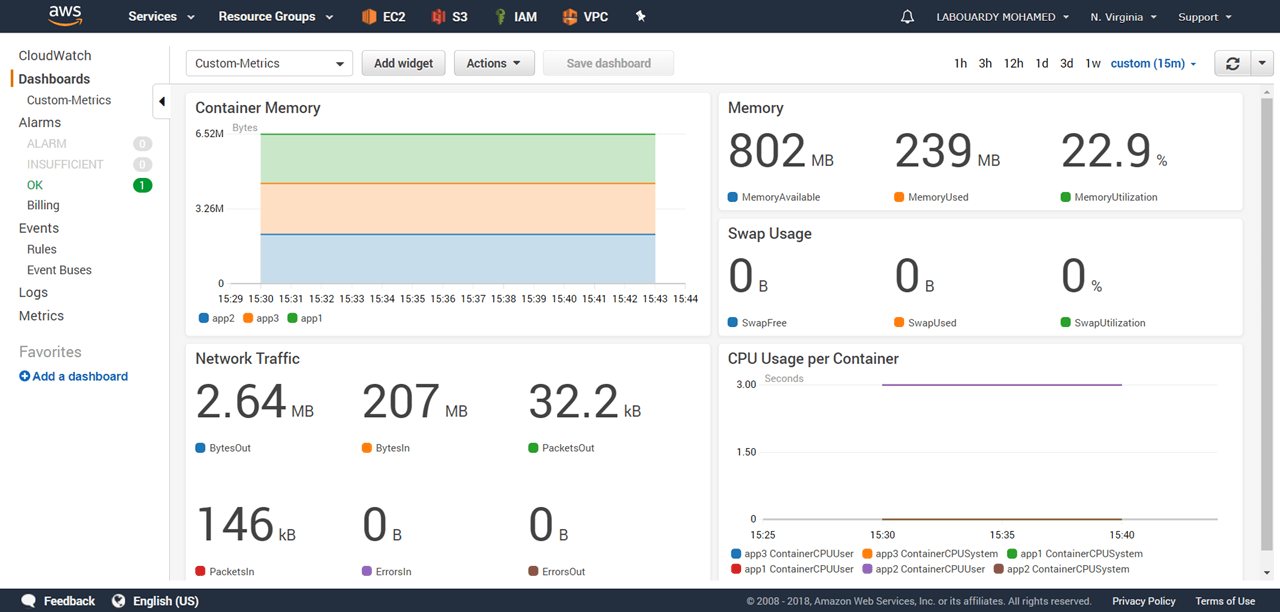
You can create your own interactive and dynamic Dashboard based on these metrics:
Hope it helps ! The CLI is still in its early stages, so you are welcome to contribute to the project on GitHub.
Drop your comments, feedback, or suggestions below — or connect with me directly on Twitter @mlabouardy.