The main goal of collecting metrics is to store them for long term usage and to create graphs to debug problems or identify trends. However, storing metrics about your system isn’t enough to identity the problem’s & anomalies root cause. It’s necessary to have a high-level overview of your network backbone. Weathermap is perfect for a Network Operations Center (NOC). In this post, I will show you how to build one using Open Source tools only.
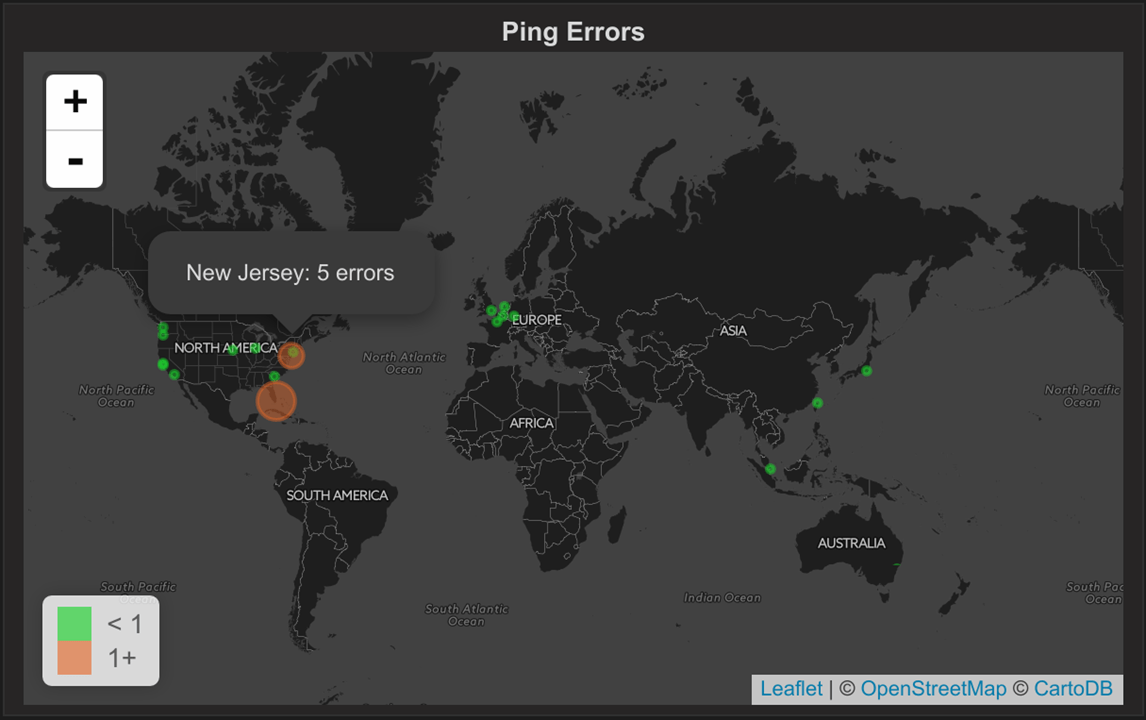
Icinga 2 will collect metrics about your backbone, write checks results metrics and performance data to InfluxDB (supported since Icinga 2.5). Visualize these metrics in Grafana in map form.
To get started, add your desired host configuration inside the hosts.conf file:
1 | object Host "server1" { |
Note: the city & country attributes will be used to create the weathermap.
To enable the InfluxDBWriter on your Icinga 2 installation, type the following command:
1 | icinga2 feature enable influxdb |
Configure your InfluxDB host and database in /etc/icinga2/features-enabled/influxdb.conf (Learn more about the InfluxDB configuration)
1 | library "perfdata" |
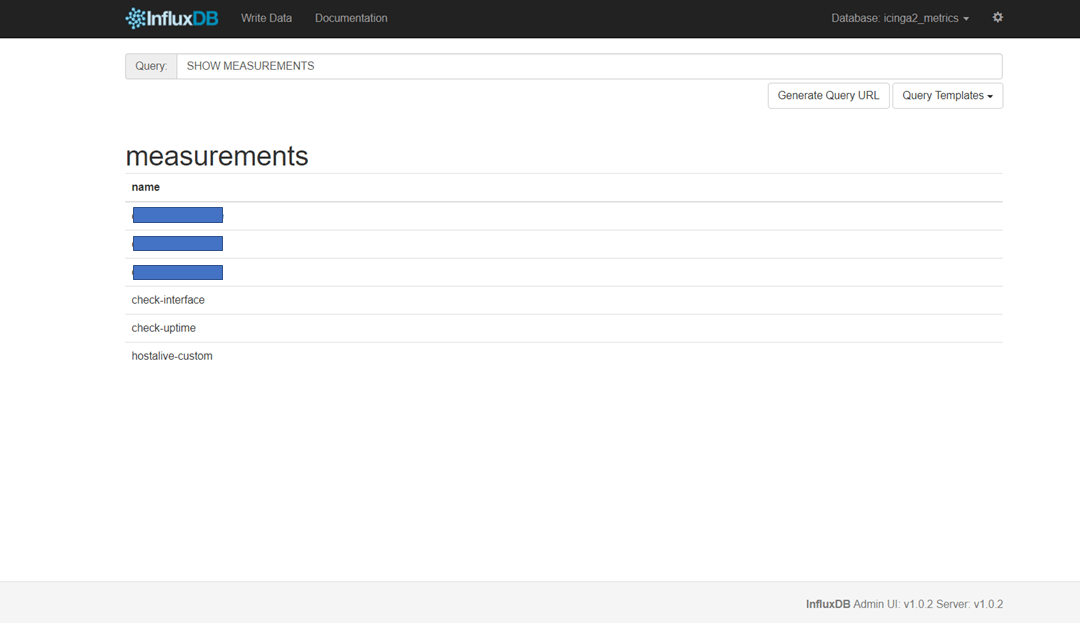
Icinga 2 will forward all your metrics to a icinga2_metrics database. The included host and service templates define a storage, the measurement represents a table by which metrics are grouped with tags certain measurements of certain hosts or services are defined (notice the city & country tags usage).
Don’t forget to restart Icinga 2 after saving your changes:
1 | service icinga2 restart |
Once Icinga 2 is up and running it’ll start collecting data and writing them to InfluxDB:
Once our data arrived, it’s time for visualization. Grafana is widely used to generate graphs and dashboards. To create a Weathermap we can use a Grafana plugin called Worldmap Panel. Make sure to install it using grafana-cli tool:
1 | grafana-cli plugins install grafana-worldmap-panel |
The plugin will be installed into your grafana plugins directory (/var/lib/grafana/plugins):
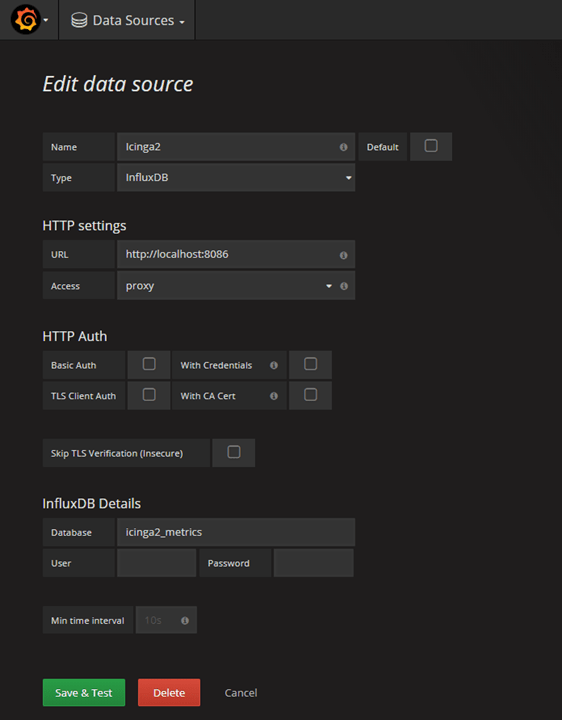
Restart Grafana, navigate to Grafana web interface and create a new datasource:
Create a new Dashboard:

The Group By clause should be the country code and an alias is needed too. The alias should be in the form $tag_field_name. See the image below for an example of a query:

Under the Worldmap tab, choose the countries option:

Finally, you should see a tile map of the world with circles representing the state of each host.
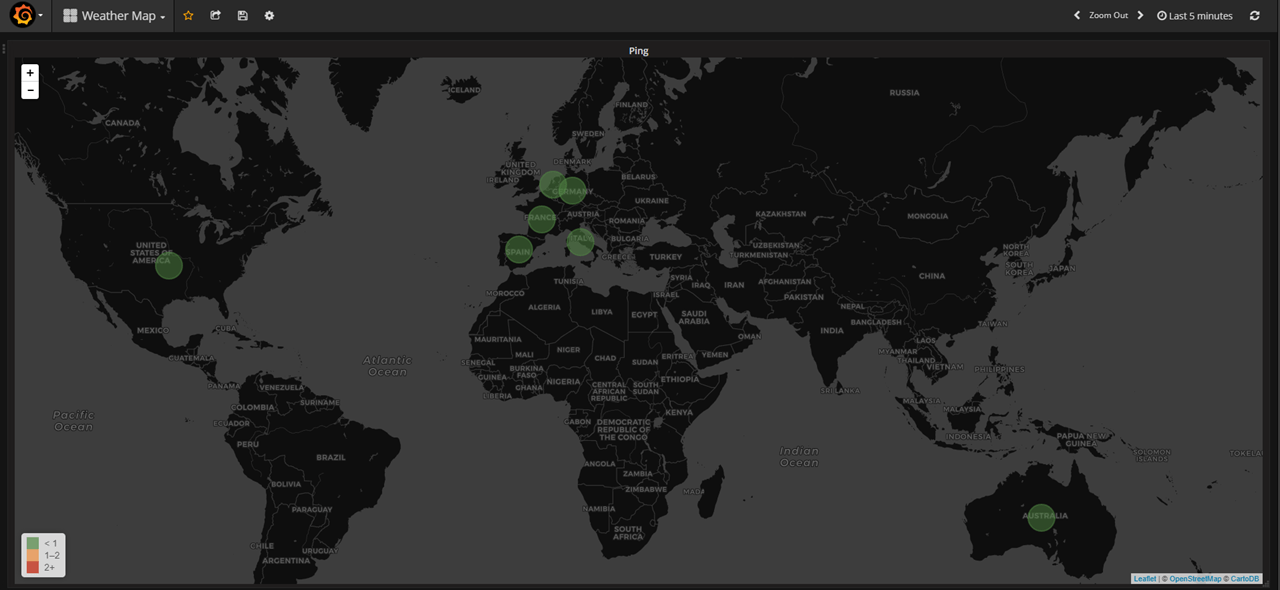
The field state possible values (0 – OK, 1 – Warning, 2 – Critical, 3 – Unknown/Unreachable)
Note: For lazy people I created a ready to use Dashboard you can import from GitHub.
Drop your comments, feedback, or suggestions below — or connect with me directly on Twitter @mlabouardy.


