
Hybrid cloud is the new reality. Therefore, you will need a single tool, general purpose dashboard and graph composer for your global infrastructure. That’s where Grafana comes into play. Due to it’s pluggable architecture, you have access to many widgets and plugins to create interactive & user-friendly dashboards. In this post, I will walk you through on how to create dashboards in Grafana to monitor in real-time your EC2 instances based on metrics collected in AWS CloudWatch.
To get started, create an IAM role with the following IAM policy:
1 | { |
Launch an EC2 instance with the user-data script below. Make sure to associate to the instance the role we created earlier:
1 | #!/bin/sh |
On the security group section, allow inbound traffic on port 3000 (Grafana Dashboard).
Once created, point your browser to the http://instance_dns_name:3000, you should see Grafana Login page (default credentials: admin/admin) :

Grafana ships with built in support for CloudWatch, so add a new data source:
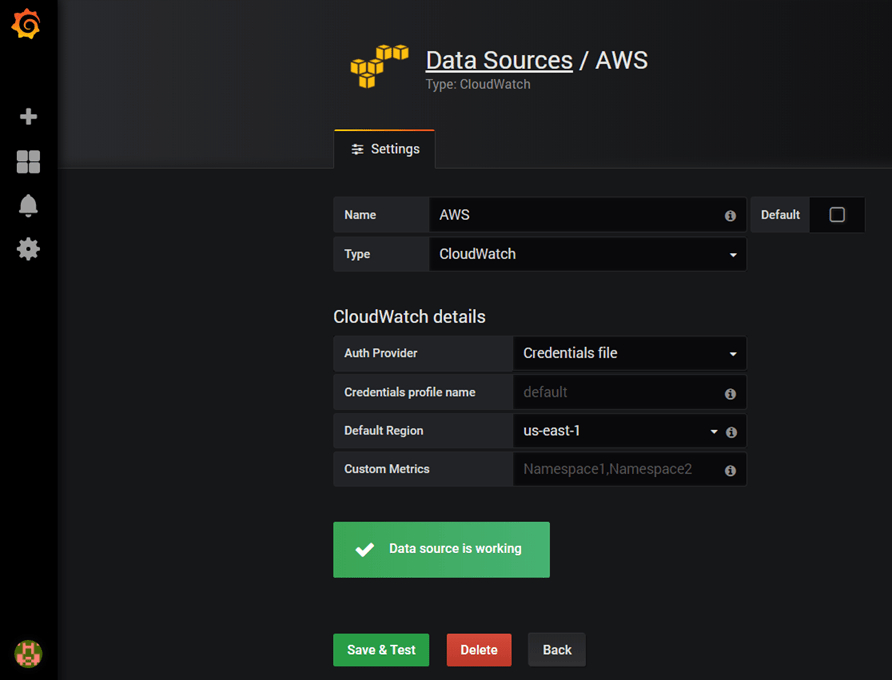
Note: In case you are using an IAM Role (recommended), keep the other fields empty as above, otherwise, create a new file at ~/.aws/credentials with your own AWS Access Key & Secret key.
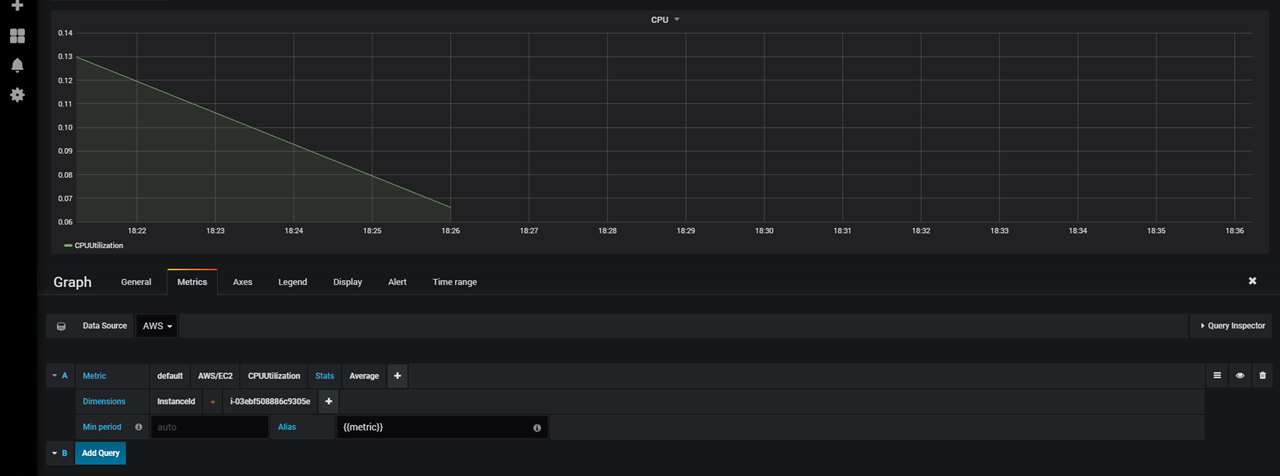
Create a new dashboard, and add new graph to the panel, select AWS/EC2 as namespace, CPUUtilization as metric, and the instance id of the instance you want to monitor in the dimension field:
That’s great !

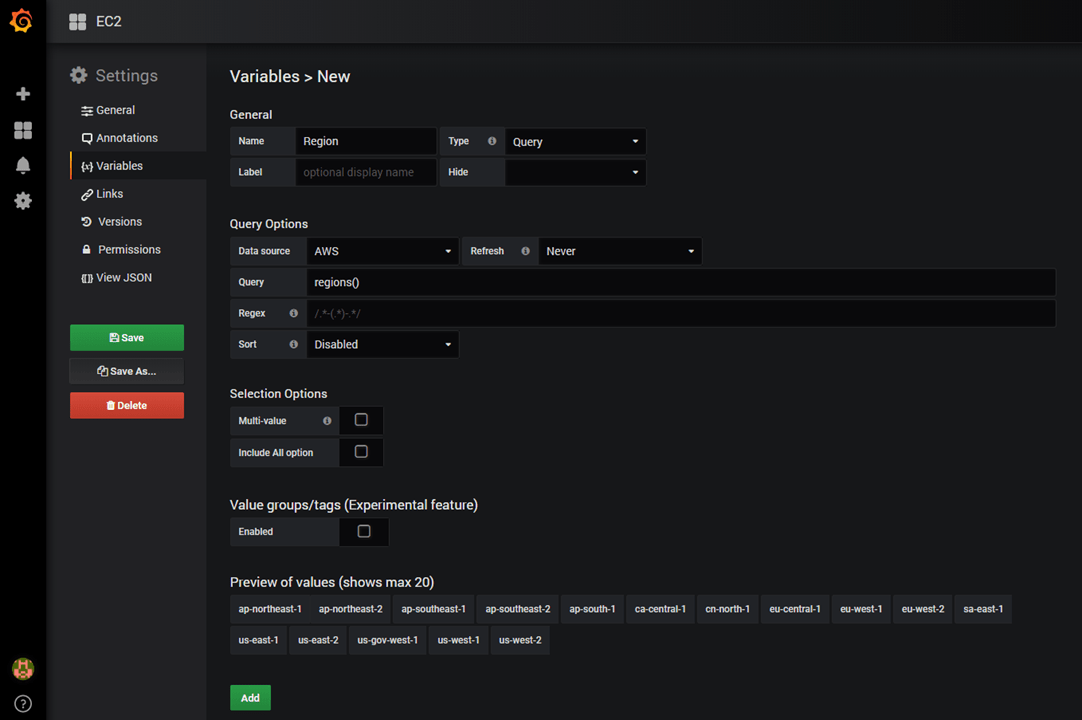
Well, instead of hard-coding the InstanceId in the query, we can use a feature in Grafana called “Query Variables“. Create a new variable to hold list of AWS supported regions :
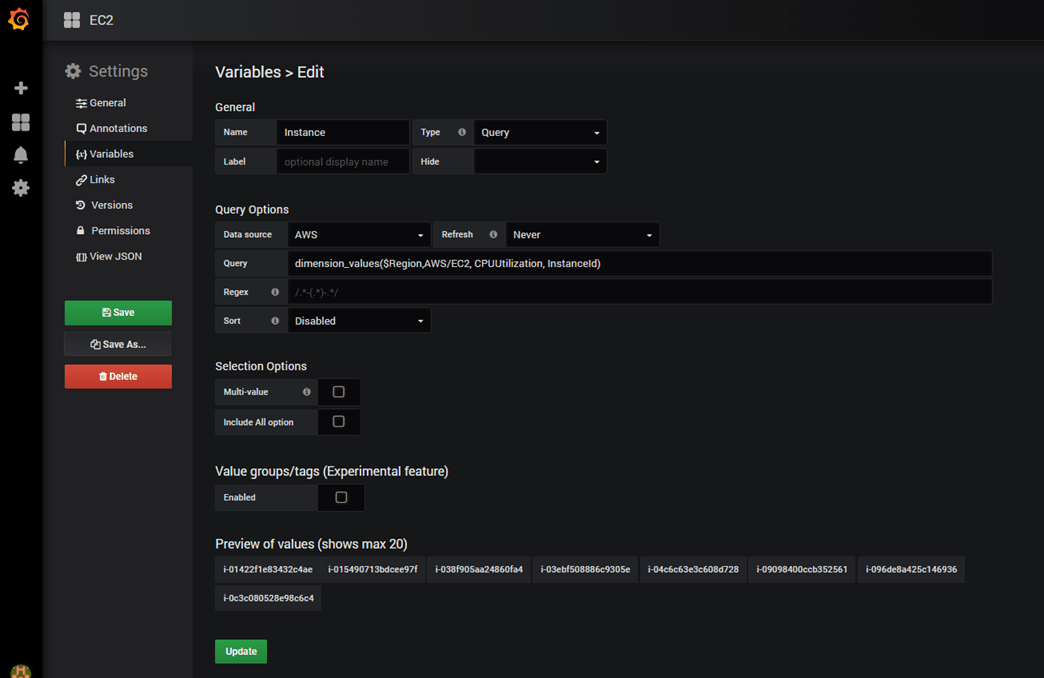
And, create a second variable to store list of instances ids per selected AWS region:
Now, go back to your graph and update the query as below:
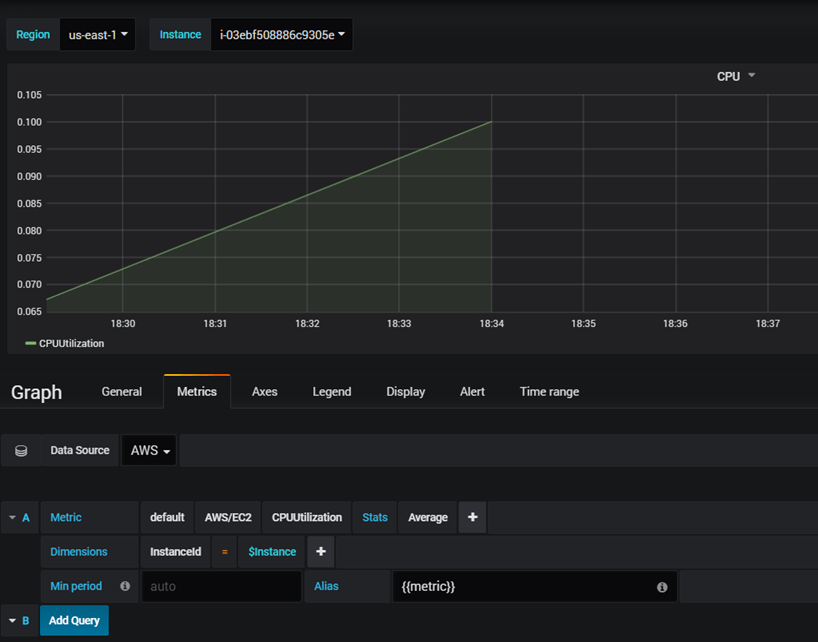
That’s it, go ahead and create other widgets:
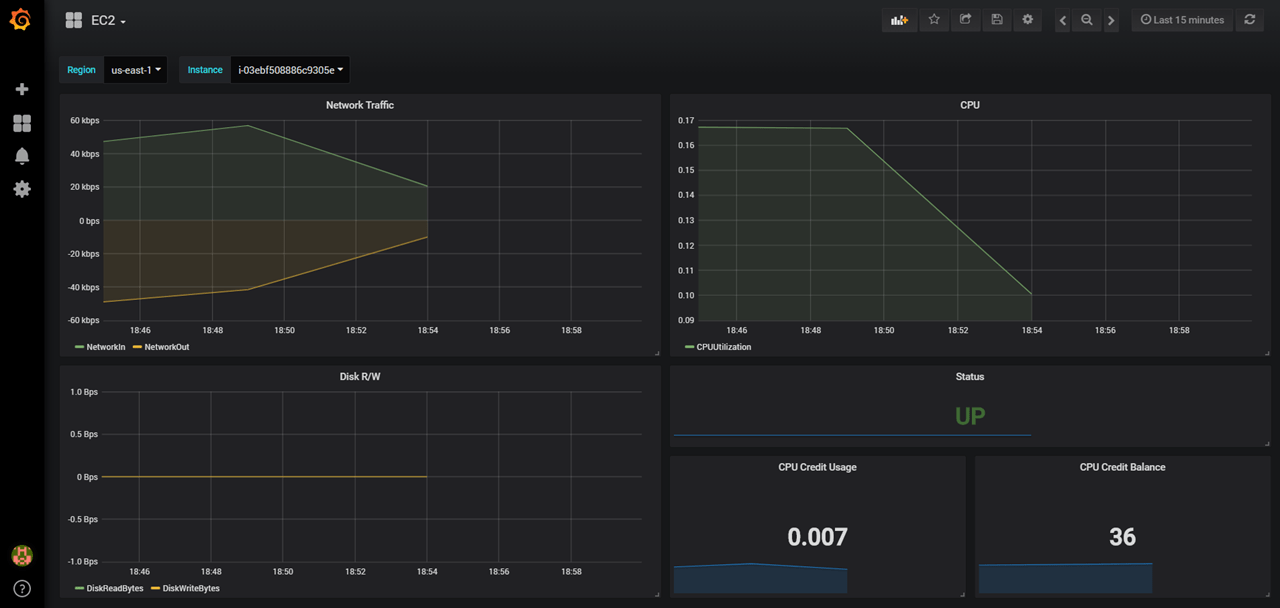
Note: You can download the dashboard from GitHub.
Now you’re ready to build interactive & dynamic dashboards for your CloudWatch metrics.
Drop your comments, feedback, or suggestions below — or connect with me directly on Twitter @mlabouardy.
